
Figure 1
- ID
- ZDB-FIG-210714-28
- Publication
- Lord et al., 2021 - The pattern of Nodal morphogen signaling is shaped by co-receptor expression
- Other Figures
- All Figure Page
- Back to All Figure Page
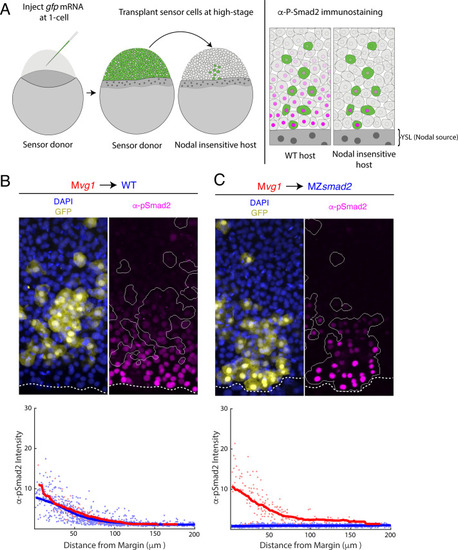
(A) Schematic of sensor cell assay. Mvg1 donor embryos were marked by injecting gfp mRNA at the 1-cell stage. At high stage, just before the onset of Nodal signaling, GFP-marked sensor cells were transplanted from the animal pole of the donor to the margin of a Nodal-insensitive host. At 50% epiboly, embryos were fixed and immunostained for GFP and Nodal signaling activity (α-pSmad2). Imaging of chimeric embryos (far right) enables inference of the gradient shape from α-pSmad2 staining (magenta) in sensor cells (green). Because host embryos lack the ability to respond to Nodal, YSL-derived Nodal ligands are responsible for the shape of the Nodal signaling gradient. (B) Control visualization of the Nodal signaling gradient in wild-type hosts using a sensor cell assay. Upper panel; Mvg1 sensor cells (yellow) were transplanted to the margin of a wild-type host. Nodal signaling was visualized by α-pSmad2 staining (magenta), and sensor cell boundaries were segmented with an automated pipeline (white curves). YSL boundaries are marked with dashed white curves. Lower panel; quantification of staining intensity in host (blue) and sensor (red) cells across replicate embryos. Nuclei were segmented from DAPI signal using an automated analysis pipeline implemented in MATLAB. Sensor and host cells were identified as being clearly GFP positive or negative, respectively. Solid curves represent sliding window averages. Plot was derived from three replicate embryos. (C) Sensor cell assay in MZsmad2 host embryos. Upper panel; GFP-marked Mvg1 sensor cells (yellow) were transplanted to the margin of MZsmad2 host embryos. Nodal signaling was visualized with α-pSmad2 staining (magenta). Sensor cell boundaries are marked with white outlines, and YSL boundaries are marked with dashed white curves. Lower panel; quantification of host (blue) and sensor (red) cell staining intensities were carried out as in (B). Plot was derived from six replicate embryos. |