|
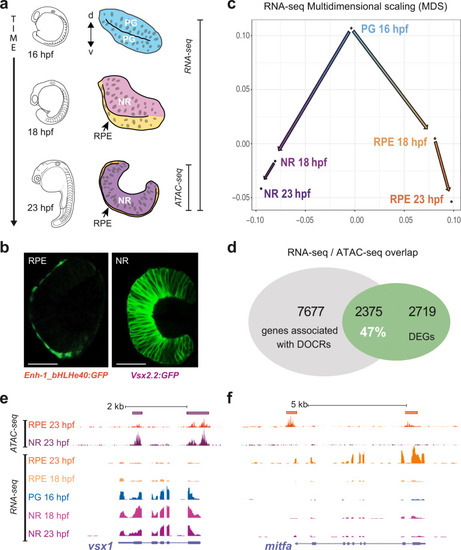
Experimental setup and raw data.a Schematic representation of optic vesicle morphogenesis from undifferentiated retinal progenitor cells (PG, blue), at 16 hpf, to segregation and differentiation of the neural retina (NR, purple) and pigmented epithelium (RPE, orange) domains at 18 and 23 hpf. NR and RPE populations isolated by flow cytometry were analyzed by RNA-seq and ATAC-seq at the stages indicated. b Stage 23 hpf confocal sections from the zebrafish transgenic lines used to mark and isolate the RPE (E1_bHLHe40:GFP) and NR (vsx2.2:GFP) populations. Bar = 50 µm. c Multidimensional scaling analysis of the RNA-seq data showing a progressive transcriptomic divergence between the NR and RPE domains. d Percentage of overlapping between differentially expressed genes (DEGs) and genes associated with differentially opened chromatin regions (DOCRs). e, f Overview of ATAC-seq and RNA-seq tracks (UCSC browser) for representative NR (vsx1; (e)) and RPE (mitfa; (f)) specific genes. Solid bars on the top indicate DOCRs. If purple, the DOCR is more accessible in the NR. On the contrary, if orange, the DOCR is more accessible in the RPE. In the depicted case all the DOCRs are accompanied by increased transcription of the associated gene in the corresponding tissue.
|

