
Fig. 11
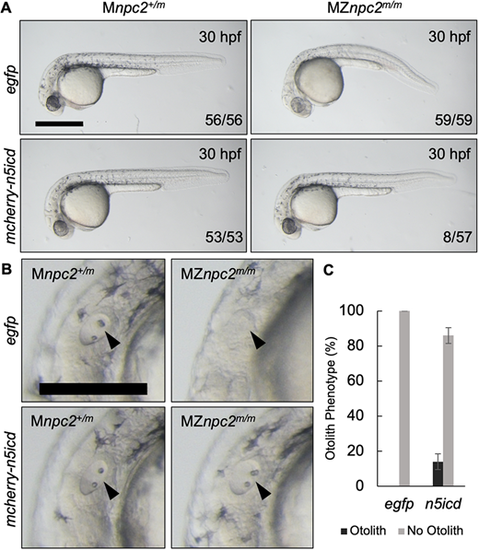
(A) Live imaging of 30 hpf Mnpc2+/m and MZnpc2m/m embryos injected with either egfp or mcherry-n5icd (notch3 intracellular domain) plasmid DNA at the 1-cell stage. Some of the mcherry-n5icd-injected MZnpc2m/m embryos (13.92±4.43%) displayed a relatively normal phenotype in comparison with egfp-injected MZnpc2m/m embryos. Numbers of embryos examined showing representing staining over total numbers of embryos examined are indicated in each image (n=4 experiments). Scale bar: 500 μm. (B) Magnifications of the images shown in A in the area of the otic vesicle. Both otoliths and otic vesicle were restored in this mcherry-n5icd-injected MZnpc2m/m embryo (arrowheads). Scale bar: 250 μm. (C) Quantification of otolith phenotype recovery in egfp- (n=59) and mecherry-n5icd-injected MZnpc2m/m embryos (n=58). P=0.0028 for ‘no otolith' in n5icd-treated group versus ‘no otolith' in egfp-treated group (χ2, Fisher's exact text). |