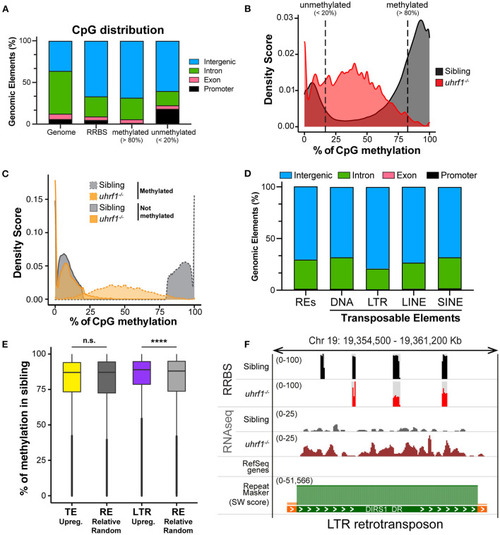
DNA methylation is enriched on TEs that become activated in uhrf1 mutants. RRBS analysis on genomic DNA of TEs in uhrf1−/− mutant larvae. (A) Genomic Annotation of all CpGs common to the unified dataset from uhrf1−/− mutants and WT siblings are divided by level of methylation in WT siblings in methylated (>80%; 616,305 CpGs) and unmethylated (< 20%; 212,750 of CpGs) and were then classified based on their location in annotated genomic element. (B) Density plot of percentage of methylation of CpGs in uhrf1−/− mutants and wild-type siblings. (C) Density plot CpGs in uhrf1−/− mutants and wild-type sibling. CpGs were classified based on the percentage of methylation in the sibling in methylated (>80%) (dashed gray line) and not methylated (< 20%) (solid gray line). For each group, methylation levels were plotted for both mutants (dashed orange line) and siblings (solid orange line). (D) Genomic annotation of CpGs covered in RRBS and overlapping with the TEs annotated in the RNAseq. (E) Box plot describing the percentage of methylation of CpGs in WT siblings: from left, CpGs contained in TEs upregulated (padj < 0.05 and log2 fold change > 0 in uhrf1−/−mutants–yellow) and in equal number of REs randomly selected (193,397 regions–dark gray); CpGs contained in LTRs upregulated (padj < 0.05 and log2 fold change > 0 in uhrf1−/−mutants–purple) and in equal number of REs randomly selected (30,353 regions–gray). ****p < 0.0001 calculated by unpaired non-parametric Mann–Whitney test. (F) Genome browser screenshot shows an example of RNA transposons (LTR retrotransposon, DIRS1_DR) that is demethylated and expressed in uhrf1−/− mutants. SW score is determined by Repeat Masker and it is used as indicator of the age of transposons. High SW score corresponds to highly conserved TEs, indicating younger TE.
|

