
FIGURE
Fig. 3
- ID
- ZDB-FIG-210318-10
- Publication
- Kawasaki et al., 2021 - Coevolution of enamel, ganoin, enameloid, and their matrix SCPP genes in osteichthyans
- Other Figures
- All Figure Page
- Back to All Figure Page
Fig. 3
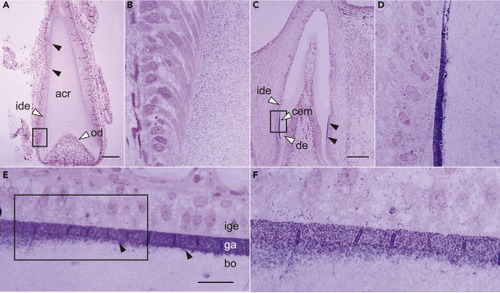
(A–F) Optical IHC analysis of gar Scpp5 in acrodin (A and B) and collar enamel (C and D) in teeth, and ganoin in a scale (E and F). The rectangular region in (A), (C), and (E) is enlarged in (B), (D), and (F), respectively. IHC signals in (A), (C), and (E) are shown by closed arrowheads. Vertical lines in the ganoin layer (E and F) are artifacts of sectioning. See the legend of Figure 2 for abbreviations. Scale bar, 100 μm (A and C) or 20 μm (E). The contrast of these images was enhanced uniformly over the entire field (see Figure S2B for original images). |
Expression Data
Expression Detail
Antibody Labeling
Phenotype Data
Phenotype Detail
Acknowledgments
This image is the copyrighted work of the attributed author or publisher, and
ZFIN has permission only to display this image to its users.
Additional permissions should be obtained from the applicable author or publisher of the image.
Full text @ iScience