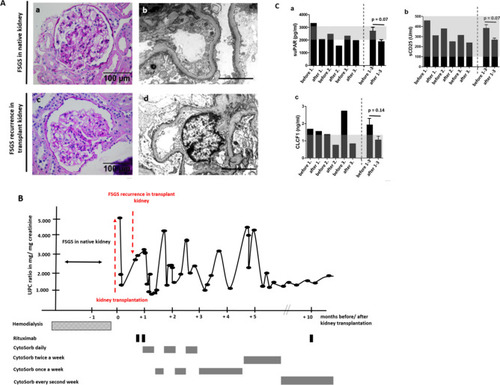
CytoSorb apheresis to treat therapy resistant and early recurrent FSGS. (A)—(a) PAS staining of native kidney biopsy of the patient at the time of initial diagnosis of FSGS. Scale bar = 100 µm. (b) Transmission electron microscopy picture of native kidney biopsy of the patient at the time of initial diagnosis of FSGS. Scale bar = 1 µm. (c) PAS staining of transplant kidney biopsy of the patient at the time of the diagnosis of recurrence of podocytopathy. Scale bar = 100 µm. (d) Transmission electron microscopy picture of transplant kidney biopsy of the patient at the time of the diagnosis of recurrence of podocytopathy. Scale bar = 1 µm. (B) Illustration of clinical course of the patient. Proteinuria measured as urine-protein-creatinine-ratio (UPC-ratio) is given in black dots and lines. Time points of kidney transplantation, transplant kidney biopsy, Rituximab treatment and CytoSorb apheresis schedule are illustrated. (C) Measurements for suPAR (a), sCD25 (b) and CLCF1 (c) in serum samples of the patient before and after first, second and third CytoSorb apheresis. The last two columns depict the mean of measurements for the parameters before and after apheresis 1–3. Normal reference levels are shown in gray. Differences before and after CytoSorb apheresis were not significant for suPAR, CLCF1 and sCD25.
|
