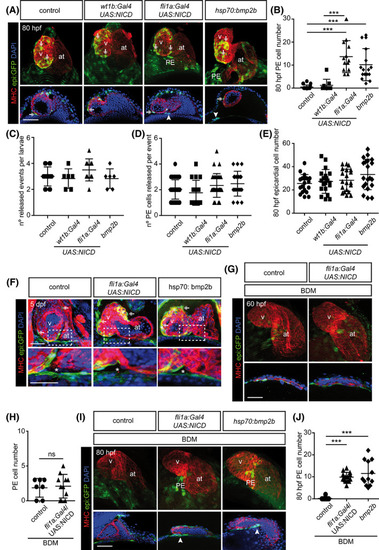
Notch signaling rescues proepicardium formation upon Myosin‐II inhibition at 80 hpf. A, E, and G, epi:GFP embryos immunostained for GFP (green), myosin heavy chain (MHC, red) and nuclei counterstained with DAPI (blue). Top panels, 3D projections and lower panels optical sections. The DP was digitally isolated in 3D projections. A, 80 hpf control zebrafish heart compared with those overexpressing NICD in pericardial and PE cells (wt1b:Gal4), endothelial cells (fli1a:Gal4) or bmp2b overexpressing embryos. Arrowheads, PE cluster. Arrows, epicardial cells. B, Quantification of PE cell number in A. C, Number of PE release events per larvae observed from 58 to 65 hpf. D, Number of PE cells released per event of cell release per larvae from 58 to 65 hpf. E, Quantification of epicardial cell number in A. F, Top panels, maximal projection of three optical sections and zoomed views are shown below. 5 days post fertilization (5 dpf) control zebrafish heart compared with those overexpressing NICD in endothelial cells (fli1a:Gal4) or bmp2b overexpressing embryos. Asterisk mark the region of PE formation at 60 hpf. Arrows, epicardial cells. G, 60 hpf BDM‐treated control zebrafish heart and heart from embryo overexpressing NICD in fli1a+ endothelial cells. H, Quantification of PE cell number of conditions as shown in G. I, 80 hpf BDM‐treated control heart, heart from embryo overexpressing NICD in fli1a+ endothelial cells and heart from an embryo overexpressing bmp2b. Arrowheads, PE cluster. J, Quantification of PE cell number of conditions shown in I. at, atrium; BDM, 2,3‐butanedione monoxime; DP, dorsal pericardium; hpf; hours post fertilization; PE, proepicardium; v, ventricle. Scale bars: 50 μm. Data are means ± SD, one‐way ANOVA followed by Kruskal‐Wallis significant difference test, unpaired two‐tailed Student's t‐test in H. ***P < .001, ns, nonsignificant
|
