FIGURE SUMMARY
Title

Notch and Bmp signaling pathways act coordinately during the formation of the proepicardium

Authors
Andrés-Delgado, L., Galardi-Castilla, M., Münch, J., Peralta, M., Ernst, A., González-Rosa, J.M., Tessadori, F., Santamaría, L., Bakkers, J., Vermot, J., de la Pompa, J.L., Mercader, N.
Source
Full text @ Dev. Dyn.

Notch signaling in the endothelium is necessary for proepicardium formation. A, 3D projections, optical sections and zoomed images of a 60 hpf control zebrafish heart compared with a RO‐treated animal. epi:GFP animals immunostained for GFP (green), F‐actin is detected with fluorescently‐labeled phalloidin (red) and nuclei counterstained with DAPI (blue). Arrowhead, PE cluster. Arrows, accumulation of F‐actin in the PE. B, Quantification of actin intensity (arbitrary units) in PE cells from conditions shown in A. C, Quantification of PE cell number in A. D, Top panels, 3D projection of a 60 hpf zebrafish heart, middle panels optical section and zoomed images below. The DP was digitally isolated in 3D projections. Control compared to those overexpressing NICD in pericardial and proepicardial cells (wt1b:Gal4) or in endothelial cells (fli1a:Gal4). epi:GFP embryos immunostained for GFP (green), myosin heavy chain (MHC, red) and nuclei counterstained with DAPI (blue). Arrowheads, PE cluster. E, Quantification of PE cell number in D. at, atrium; DP, dorsal pericardium; hpf; hours post fertilization; PE, proepicardium; v, ventricle. Scale bar: 50 μm. Data are means ± SD. Unpaired two‐tailed Student's t‐test in B and C. One‐way ANOVA followed by Kruskal‐Wallis significant difference test in E. *P < .05, ***P < .001

Notch signaling is active in endothelial cells. A, 3D projection and optical section of a 60 hpf epi:GFP; kdrl:mCherry double transgenic embryos. GFP+ pericardium and PE are shown in green, the mCherry+ endothelium is in red. Arrowhead, PE cluster. B, Maximum projection and optical sections of a 60 hpf zebrafish heart. lnfg:GFP+ cells (green) colocalize with the endogenous mCherry+ endothelium (red) of kdrl:mCherry. Arrows, lnfg:GFP+/kdrl:mCherry+ cells. C, Optical sections through the avc and vp heart regions of 60 hpf wt1b:Gal4;UAS:mCherry; lnfg:GFP embryos immunostained for mCherry (red), GFP (green), myosin heavy chain (MHC, white) and nuclei counterstained with DAPI (blue). Zoomed views including single channels are shown below. Arrowheads, PE cluster. D, Fluorescent in situ mRNA hybridization on a 60 hpf fli1a:GFP ventricular heart section with notch1b riboprobe (green) followed by immunofluorescence for GFP (red) and myosin heavy chain (MHC, gray). Nuclei are counterstained with DAPI (blue). at, atrium; avc, atrioventricular canal; DP, dorsal pericardium; hpf; hours post fertilization; PE, proepicardium; v, ventricle; vp, venous pole. Scale bar: 50 μm (25 μm in C middle images and in D; 10 μm in C zoomed images)

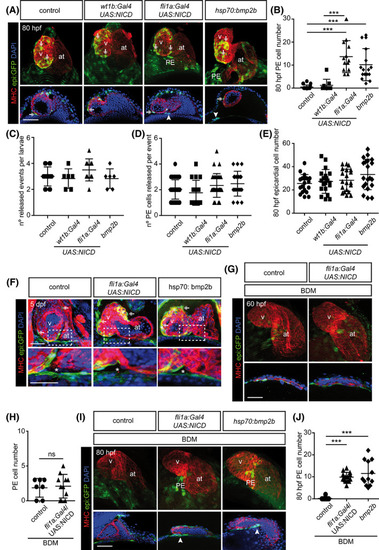
Notch signaling rescues proepicardium formation upon Myosin‐II inhibition at 80 hpf. A, E, and G, epi:GFP embryos immunostained for GFP (green), myosin heavy chain (MHC, red) and nuclei counterstained with DAPI (blue). Top panels, 3D projections and lower panels optical sections. The DP was digitally isolated in 3D projections. A, 80 hpf control zebrafish heart compared with those overexpressing NICD in pericardial and PE cells (wt1b:Gal4), endothelial cells (fli1a:Gal4) or bmp2b overexpressing embryos. Arrowheads, PE cluster. Arrows, epicardial cells. B, Quantification of PE cell number in A. C, Number of PE release events per larvae observed from 58 to 65 hpf. D, Number of PE cells released per event of cell release per larvae from 58 to 65 hpf. E, Quantification of epicardial cell number in A. F, Top panels, maximal projection of three optical sections and zoomed views are shown below. 5 days post fertilization (5 dpf) control zebrafish heart compared with those overexpressing NICD in endothelial cells (fli1a:Gal4) or bmp2b overexpressing embryos. Asterisk mark the region of PE formation at 60 hpf. Arrows, epicardial cells. G, 60 hpf BDM‐treated control zebrafish heart and heart from embryo overexpressing NICD in fli1a+ endothelial cells. H, Quantification of PE cell number of conditions as shown in G. I, 80 hpf BDM‐treated control heart, heart from embryo overexpressing NICD in fli1a+ endothelial cells and heart from an embryo overexpressing bmp2b. Arrowheads, PE cluster. J, Quantification of PE cell number of conditions shown in I. at, atrium; BDM, 2,3‐butanedione monoxime; DP, dorsal pericardium; hpf; hours post fertilization; PE, proepicardium; v, ventricle. Scale bars: 50 μm. Data are means ± SD, one‐way ANOVA followed by Kruskal‐Wallis significant difference test, unpaired two‐tailed Student's t‐test in H. ***P < .001, ns, nonsignificant

Endothelial Notch signaling enhances cardiac Bmp2/4 expression levels and induces pSmad 1/5 in the dorsal pericardium and proepicardium. A and B, Whole‐mount in situ hybridization for bmp4 or bmp2b in control, RO‐treated and animals overexpressing NICD in endothelial cells (fli1a:Gal4). A, 60 hpf. B, 80 hpf. White arrows, venous pole. Black arrows, atrioventricular canal of the heart tube. C, Quantification of pSmad 1/5+ DP cell numbers at 60 hpf. D, Quantification of pSmad1/5+ PE cell numbers at 60 hpf. E, epi:GFP embryos immunostained for GFP (green), myosin heavy chain (MHC, red), pSmad1/5 (white) and nuclei counterstained with DAPI (blue). Top panels, optical sections of a 60 hpf control zebrafish heart compared with hearts from zebrafish overexpressing NICD in pericardial and PE cells (wt1b:Gal4) or in endothelial cells (fli1a:Gal4). Zoomed views are shown below. Arrowheads, PE cluster. Yellow asterisks, PE pSmad1/5+ cells. F, Quantification of DP pSmad1/5+ cell number at 80 hpf. G, 3D projections, optical sections and zoomed images of 80 hpf control zebrafish heart compared to those overexpressing NICD in pericardial and proepicardial cells (wt1b:Gal4) or in endothelial cells (fli1a:Gal4). The DP was digitally isolated in 3D projections. Arrowheads, PE cluster. Arrows, epicardial cells. Yellow asterisks, pSmad1/5+ PE cells. H, Quantification of PE pSmad 1/5+ cell number at 80 hpf. at, atrium; DP, dorsal pericardium; hpf; hours post fertilization; PE, proepicardium; v, ventricle. Scale bar: 50 μm (25 μm in zoomed images E, G). Data in C, D, F, and H are means ± SD, one‐way ANOVA followed by Kruskal‐Wallis significant difference test. *P < .05, **P < .01, ***P < .001

Endothelial Notch signaling acts upstream of Bmp to control PE formation. A and D, epi:GFP embryos at 60 hpf (A) or 80 hpf (D) either untreated or treated with LDN‐193189 or RO4929097 and immunostained for GFP (green), myosin heavy chain (MHC, red), pSmad1/5 (white) and nuclei counterstained with DAPI (blue). Top panels, 3D projections and lower panels optical sections. The DP was digitally isolated in 3D projections. Arrowhead, PE cluster. Arrows, epicardial cells. B, Quantification of PE cell number in A. C, Quantification of DP pSmad1/5+ cell number in A. E, Quantification of PE cell number in D. F, Quantification of DP pSmad1/5+ cell number in D. at, atrium; DP, dorsal pericardium; hpf, hours post fertilization; LDN, LDN‐193189; PE, proepicardium; RO, RO4929097; v, ventricle. DP digitally isolated in 3D projections. Scale bar: 50 μm. Data are means ± SD, unpaired two‐tailed Student's t‐test. ***P < .001, ns, nonsignificant

Acknowledgments
This image is the copyrighted work of the attributed author or publisher, and ZFIN has permission only to display this image to its users. Additional permissions should be obtained from the applicable author or publisher of the image. Full text @ Dev. Dyn.