|
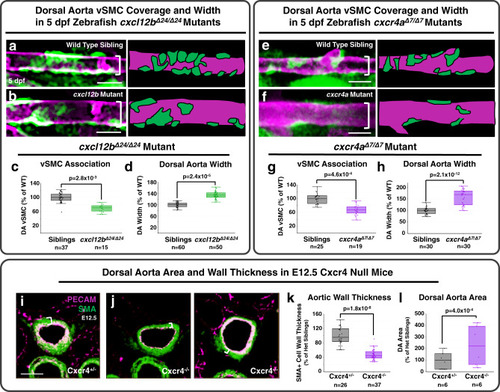
Disrupting <italic>cxcl12b/cxcr4a</italic> signaling decreases vSMC association with arteries.a, b Confocal images (left) and schematic representations (right) of the dorsal aorta (DA) in the anterior trunk of 5 dpf Tg(tagln:eGFP), Tg(kdrl:mCherry-CAAX) double-transgenic sibling (a) or cxcl12bΔ24/Δ24 mutant (b) zebrafish expressing eGFP in vSMCs (green) and mCherry-CAAX in the endothelium (magenta). c, d Quantification of the number of associated vSMC (c) and width (d) of the dorsal aorta in 5 dpf Tg(tagln:eGFP), Tg(kdrl:mCherry-CAAX) double-transgenic sibling (black columns; n = 37 (c) and n = 60 (d)) or cxcl12bΔ24/Δ24 mutant (green columns; n = 15 (c) and n = 50 (d)) larvae. Values are expressed as a percentage of control siblings and averaged from three individual experiments. e, f Confocal images (left) and schematic representations (right) of the dorsal aorta (DA) in the anterior trunk of 5 dpf Tg(tagln:eGFP), Tg(kdrl:mCherry-CAAX) double-transgenic siblings (e) or cxcr4Δ7/Δ7 mutant (f) zebrafish expressing eGFP in vSMCs (green) and mCherry-CAAX in the endothelium (magenta). The schematic representations demonstrate what were counted as cells in the adjacent panels. g, h Quantification of the number of associated vSMC (G) and width (h) of the dorsal aorta in 5 dpf Tg(tagln:eGFP), Tg(kdrl:mCherry-CAAX) double-transgenic sibling (black columns; n = 25 (g) and n = 30 (h)) or cxcr4Δ7/Δ7 mutant (purple columns; n = 19 (g) and n = 30 (h)) larvae. Values are expressed as a percentage of control siblings and averaged from three individual experiments. i, j Confocal images of immunohistochemically stained transverse sections through the dorsal aorta of E12.5 Cxcr4+/− heterozygous sibling (i) and Cxcr4−/− mutant (j) mice, probed for platelet endothelial cell adhesion molecule-1 (PECAM) for endothelium (blue) and alpha smooth muscle actin (SMA) for vascular smooth muscle (vSMC, red). White brackets note the thickness of the vSMC layer surrounding the DA. k, l Quantification of aortic wall thickness (k) and lumenal area (l) of E12.5 Cxcr4+/− heterozygous sibling (black columns; n = 26 (k) and n = 6 (l)) and Cxcr4−/− mutant (purple columns; n = 37 (k) and n = 6 (l)) mice, measured from immunohistochemically stained sections as in panels i and j. The range for wall thickness was defined by the inner and outermost SMA staining detected in the images. Values are expressed as a percentage of heterozygous siblings and averaged from three individual experiments. Scale bars = 75 µm (panels a, b, e, f), 400 µm (panels i, j). Box plots are graphed showing the median versus the first and third quartiles of the data (the middle, top, and bottom lines of the box, respectively). The whiskers demonstrate the spread of data within 1.5x above and below the interquartile range. All data points are shown as individual dots, with outliers shown above or below the whiskers. P-values are indicated above statistically significant datasets and were generated using student’s t-tests.
|

