FIGURE

Fig. 3.

ID
ZDB-FIG-200904-3
Publication
Lavergne et al., 2020 - Pancreatic and intestinal endocrine cells in zebrafish share common transcriptomic signatures and regulatory programmes
Other Figures
All Figure Page
Back to All Figure Page
Fig. 3.

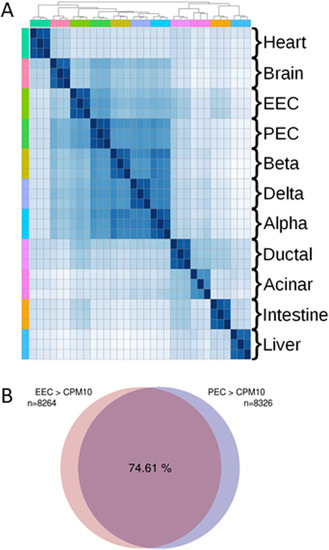
Similar gene expression profiles between zebrafish EECs and PECs. Global comparison of transcriptomic profiles (RNA-seq) from distinct zebrafish tissues/organs. a Clustered heatmap displaying the Euclidean distance matrix between every pair of zebrafish RNA-seq datasets. The order of the different tissues is identical for the two axes (rows and columns) as shown by the different colours on the upper part and left part of the matrix. Each zebrafish tissue (analysed in triplicate) was compared with the other samples as presented in the matrix. Darker colour indicates closer distance (i.e. more similar transcriptomes). EEC transcriptome is mostly similar to the transcriptome of embryonic pancreatic endocrine cells (PECs) or to the adult alpha, beta or delta pancreatic cells. The accession number of all used RNA-seq datasets is given in the “Methods” section. b Venn diagram showing the overlap (74%) of genes expressed in both EECs and PECs above the threshold of 10 CPM. A total of 8264 genes and 8326 genes were expressed above 10 CPM (counts per million) respectively in EECs and in PECs

Expression Data

Expression Detail
Antibody Labeling
Phenotype Data

Phenotype Detail
Acknowledgments
This image is the copyrighted work of the attributed author or publisher, and ZFIN has permission only to display this image to its users. Additional permissions should be obtained from the applicable author or publisher of the image. Full text @ BMC Biol.