|
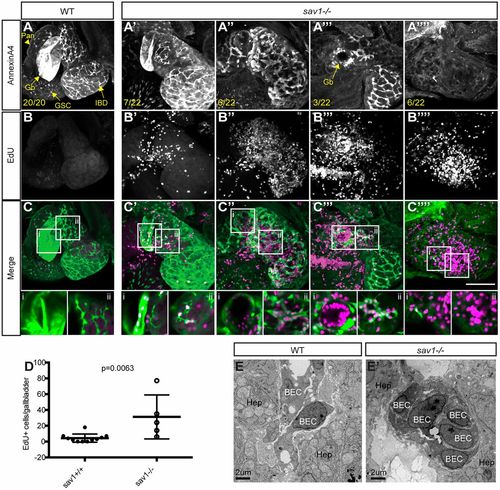
The sav1 mutant biliary system exhibits excess proliferation. (A-A″″) Whole-mount annexin A4 staining of liver and gallbladder at 8 dpf. Pan, pancreas; Gb, gallbladder; GSC, gut secretory cell; IBD, intrahepatic bile duct. n is indicated and displayed as the ratio of fish containing the displayed phenotype/total fish analyzed. (B-B″″) EdU staining of the specimen analyzed in A. (C-C″″) Merged images of A and B with annexin A4 staining in green and EdU stain in magenta. Scale bar: 100 μm. Single plane enlarged images are found below each merged image, with the left image focused on a region of gallbladder and the right image focused on intrahepatic biliary ducts. (D) Quantitation of EdU+ cells in annexin A4-labeled gallbladders; n=11 wild-type, n=5 sav1−/−. Data are mean±s.d. Unpaired t-test with equal s.d. resulted in P=0.0063. (E,E′) TEM of wild-type (E) and sav1−/− (E′) livers at 10 dpf: n=3 wild type; n=3 sav1−/−. BEC, biliary epithelial cell; Hep, hepatocyte.
|