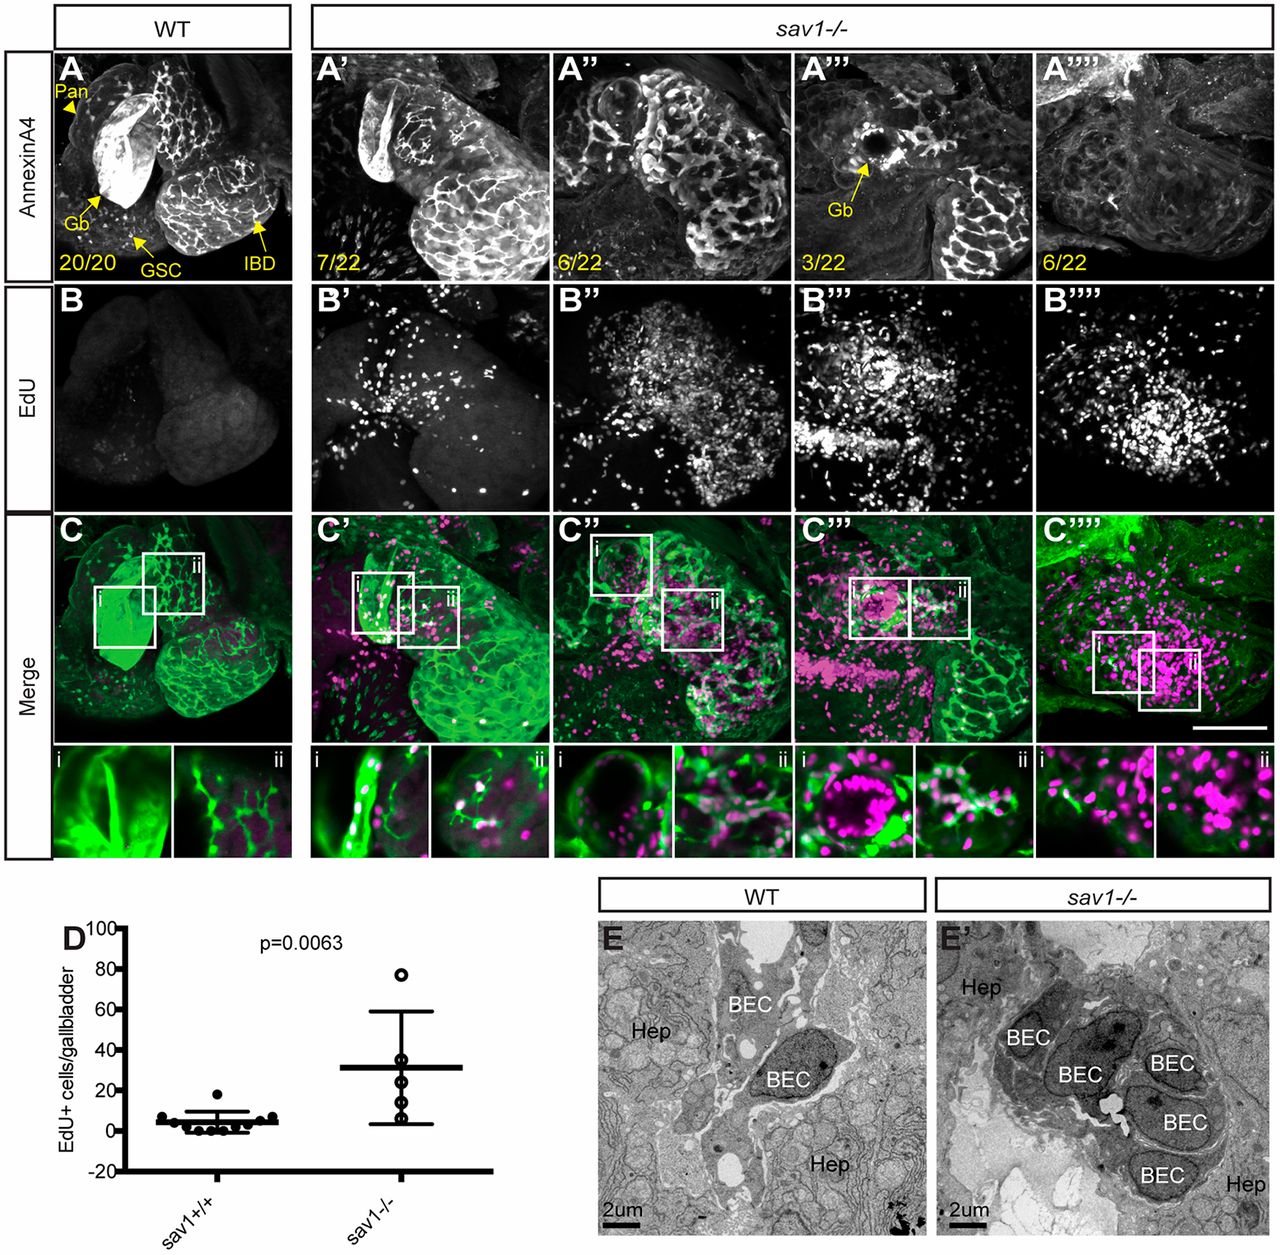
Fig. 3 The sav1 mutant biliary system exhibits excess proliferation. (A-A″″) Whole-mount annexin A4 staining of liver and gallbladder at 8 dpf. Pan, pancreas; Gb, gallbladder; GSC, gut secretory cell; IBD, intrahepatic bile duct. n is indicated and displayed as the ratio of fish containing the displayed phenotype/total fish analyzed. (B-B″″) EdU staining of the specimen analyzed in A. (C-C″″) Merged images of A and B with annexin A4 staining in green and EdU stain in magenta. Scale bar: 100 μm. Single plane enlarged images are found below each merged image, with the left image focused on a region of gallbladder and the right image focused on intrahepatic biliary ducts. (D) Quantitation of EdU+ cells in annexin A4-labeled gallbladders; n=11 wild-type, n=5 sav1−/−. Data are mean±s.d. Unpaired t-test with equal s.d. resulted in P=0.0063. (E,E′) TEM of wild-type (E) and sav1−/− (E′) livers at 10 dpf: n=3 wild type; n=3 sav1−/−. BEC, biliary epithelial cell; Hep, hepatocyte.
Image
Figure Caption
Figure Data
Acknowledgments
This image is the copyrighted work of the attributed author or publisher, and
ZFIN has permission only to display this image to its users.
Additional permissions should be obtained from the applicable author or publisher of the image.
Full text @ Development

