
Fig. s1
- ID
- ZDB-FIG-200520-18
- Publication
- Marchi et al., 2020 - Bidirectional crosstalk between Hypoxia-Inducible Factor and glucocorticoid signalling in zebrafish larvae
- Other Figures
- All Figure Page
- Back to All Figure Page
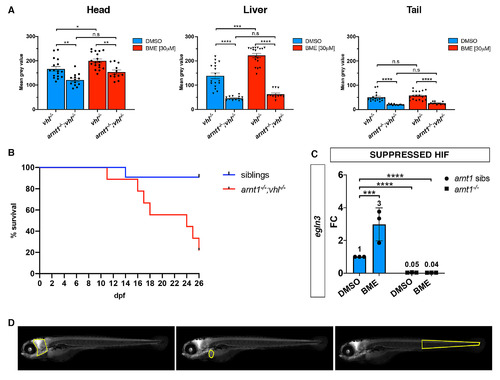
arnt1-/-; vhl-/- larvae showed a reduced phd3:eGFP brightness and a partially rescued vhl phenotype. A. Statistical analysis performed on mean gray value quantification (at the level of the head, liver and tail), after phenotypic analysis on 5dpf DMSO and BME [30μM] treated arnt1+/-;vhl+/-(phd3:eGFP) x arnt1-/-; vhl+/-(phd3:eGFP) derived larvae (n = 540). vhl-/- DMSO treated n = 17 larvae: head 166.67 ± 9.63 (mean ± s.e.m); liver 138.61 ± 12.05 (mean ± s.e.m); tail 50.31 ± 4.51 (mean ± s.e.m). arnt1-/-;vhl-/- DMSO treated n = 13 larvae: head 121.05 ± 6.99 (mean ± s.e.m); liver 49.61 ± 3.88 (mean ± s.e.m); tail 21.75 ± 1.12 (mean ± s.e.m). vhl-/- BME treated n = 18 larvae: head 199.88 ± 7.71 (mean ± s.e.m); liver 222.57 ± 8.72 (mean ± s.e.m); tail 57.57 ± 4.11 (mean ± s.e.m). arnt1-/-;vhl-/- BME treated n = 12 larvae: head 153.71 ± 8.66 (mean ± s.e.m); liver 62.58 ± 5.16 (mean ± s.e.m); tail 25.82 ± 1.54 (mean ± s.e.m). Ordinary One-way ANOVA followed by Sidak’s multiple comparison test (*P < 0.05; **P < 0.01; ***P <0.001; ****P < 0.0001). B. Kaplan-Meier survival curves of the zebrafish arnt1+/-; vhl+/-(phd3:eGFP) genotype analysed in this study. Time is shown in days. Siblings n = 30; arnt1-/-; vhl-/-(phd3:eGFP) n = 8. The Log-rank (Mantel-Cox) test was used for statistical analysis. arnt1-/-; vhl-/-(phd3:eGFP) vs. siblings: **P < 0.0027. C. RTqPCR analysis performed on arnt1 siblings (n = 10; 3 repeats) and arnt1-/- (n = 10; 3 repeats) larvae at 5 dpf, using egln3 as probe. Statistical analysis was performed on ΔΔCt values, whereas data are shown as fold change values. Ordinary Two-way ANOVA followed by Dunnett’s multiple comparison test (***P <0.001;****P < 0.0001). D. Representative picture of head, liver and tail areas selected in each larva to quantify the phd3:eGFP-related brightness via mean grey value quantification (Fiji, ImageJ software). |