|
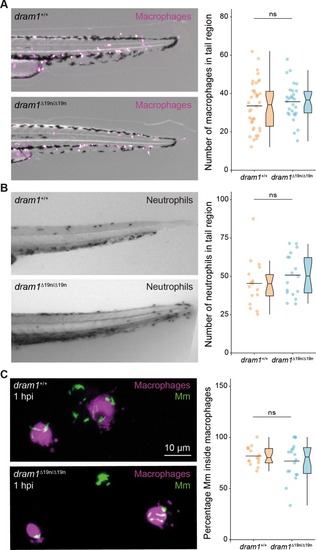
Dram1 deficiency does not affect the capability of macrophages to phagocytose Mm.a Representative stereo micrographs of macrophages in the whole tail region and quantification of the number of macrophages in this region. 3 dpf dram1∆19n/∆19n and dram1+/+/ mpeg1:mCherryF larvae were obtained from incrossed dram1+/∆19n animals and the number of macrophages for each larva were counted before determining the genotype. Genotyping was performed by PCR and Sanger sequencing (≥28 larvae/group). Data are accumulated from two independent experiments and represented by scatter and boxplots as detailed in the “Methods” section. ns non-significant, *p < 0.05,**p < 0.01,***p < 0.001. b Representative stereo images of the whole tail of 3 dpf dram1∆19n/∆19n and dram1+/+ larvae following an immunohistochemical peroxidase activity detection protocol. The number of neutrophils in this region was quantified per individual larva (≥18 larvae/group). Data are accumulated from two independent experiments and represented by scatter and boxplots as detailed in the “Methods” section. ns non-significant, *p < 0.05,**p < 0.01,***p < 0.001. c Representative confocal micrographs of macrophages located in the blood circulation over the yolk sac of infected dram1∆19n/∆19n and dram1+/+ embryos in mpeg1:mCherryF background at 1 h post-infection (hpi). Scale bars, 10 μm. Quantification of phagocytosis of Mm by macrophages at 1 hpi. dram1∆19n/∆19n and dram1+/+ embryos in mpeg1:mCherryF background were infected with Mm at 30 hpf and fixed at 1 hpi. The percentage of macrophages having phagocytosed Mm clusters was determined per individual larva (≥16 larvae/ group). Results are accumulated from two independent experiments and represented by scatter and boxplots as detailed in the “Methods” section. ns non-significant, *p < 0.05,**p < 0.01,***p < 0.001.
|

