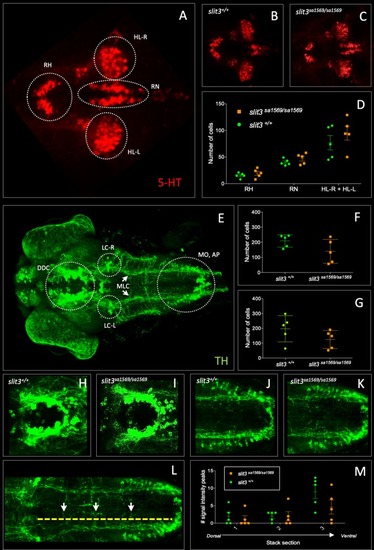
(A–D) Anti-5-HT, (E–M) anti-TH: (A) 5-HT-labelled neurons in wild type zebrafish brain. Circles indicate regions used for quantification of cell number in rostral hypothalamus (RH), inferior hypothalamic lobes (HL-R, HL-L) and raphe nucleus (RN). (B) Anti-5-HT labelled cells in slit3 wild type brain, (C) Anti-5-HT labelled cells in slit3sa1569 homozygous mutant brain. (D) Quantification of anti-5HT labelled cell number in wild type and slit3 mutant brains No significant differences were observed between wild type and slit3 mutant larvae. (E) Unprocessed maximum intensity projection of anti-TH-labelled whole mounted wild type zebrafish brain. Circles indicate areas used for quantification, or in the case of LC-R and LC-L, landmarks used as reference to determine the extension of the medial longitudinal catecholaminergic tract (MLC) used when quantifying the number of anti-TH labelled projections to the midline (panels L, M). (F) Cell quantification for diencephalic dopaminergic cluster (DDC). No significant differences were observed between wild type and slit3 mutant larvae. (G) Cell quantification for medulla oblongata interfascicular zone and vagal area, and area postrema (MO, AP). No significant differences were observed between wild type and slit3 mutant larvae. (H–K) Anti-TH labelled wild types and slit3sa1569. Zoomed-in visualization of diencephalic dopaminergic cluster (H–I) and medulla oblongata interfascicular zone and vagal area (J–K). (L–M) Quantification of catecholaminergic projections projecting to the midline. Examples of projections are indicated with yellow arrows. Projections were assessed from posterior to anterior using the locus coerulus and posterior extent of the raphe nucleus as landmarks (Panel L, yellow line) and from dorsal to ventral (Panel M, stacks 1–3). Figure 5—figure supplement 1 shows individual planes. n = 5 samples per genotype group.
|

