
Figure 3
- ID
- ZDB-FIG-200318-12
- Publication
- Weinberger et al., 2020 - Functional Heterogeneity within the Developing Zebrafish Epicardium
- Other Figures
- All Figure Page
- Back to All Figure Page
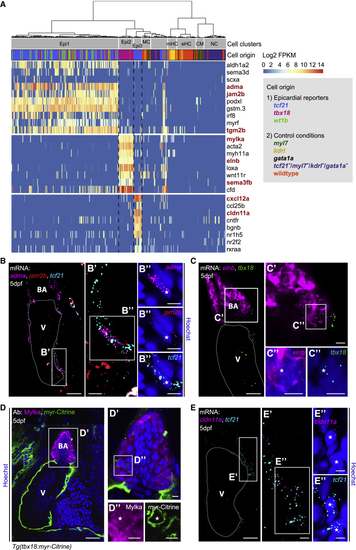
Transcriptionally Distinct Epicardial Subpopulations Epi1–3 Localize to Different Regions of the Developing Heart (A) Marker gene expression in Epi1–3. Cells were clustered in an unsupervised manner (columns). Color key indicates range of log2 transformed FPKM values. Genes analyzed further are highlighted in red. CM, cardiomyocyte; eHC, erythroid hematopoietic cell; mHC, myeloid hematopoietic cell; NC, neural cell; and MC, mesenchymal cell. (B) mRNA staining of the Epi1 markers (C) mRNA staining of the Epi2 marker (D) Antibody staining of Mylka and (E) mRNA staining of the Epi3 marker |
| Genes: | |
|---|---|
| Antibody: | |
| Fish: | |
| Anatomical Term: | |
| Stage: | Day 5 |
Reprinted from Developmental Cell, 52(5), Weinberger, M., Simões, F.C., Patient, R., Sauka-Spengler, T., Riley, P.R., Functional Heterogeneity within the Developing Zebrafish Epicardium, 574-590.e6, Copyright (2020) with permission from Elsevier. Full text @ Dev. Cell