
FIGURE
Figure 3
- ID
- ZDB-FIG-200314-70
- Publication
- Kang et al., 2020 - Global Transcriptomic Analysis of Zebrafish Glucagon Receptor Mutant Reveals Its Regulated Metabolic Network
- Other Figures
- All Figure Page
- Back to All Figure Page
Figure 3
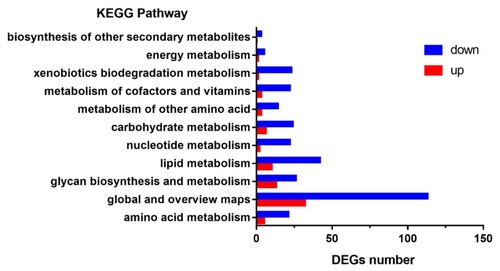
Kyoto encyclopedia of genes and genomes (KEGG) enrichment analysis of DEGs in metabolism pathways. The y-axis indicates pathways and the x-axis indicates the number of DEGs. The red bar shows the upregulated genes and the blue bar shows the downregulated genes. |
Expression Data
Expression Detail
Antibody Labeling
Phenotype Data
Phenotype Detail
Acknowledgments
This image is the copyrighted work of the attributed author or publisher, and
ZFIN has permission only to display this image to its users.
Additional permissions should be obtained from the applicable author or publisher of the image.
Full text @ Int. J. Mol. Sci.