|
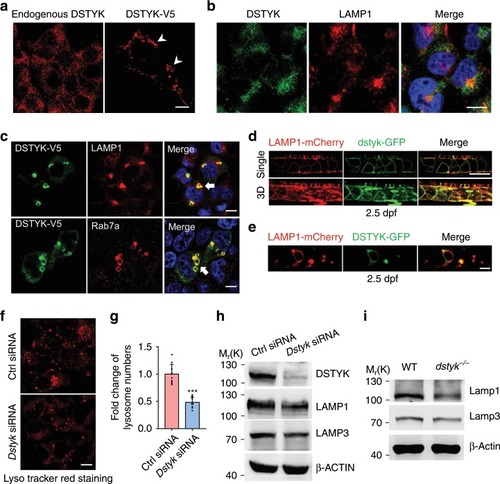
DSTYK is involved in lysosome biogenesis.a Representative images of immunofluorescent staining for endogenous DSTYK (left) and transfected with exogenous DSTYK-V5 (right) in COS-7 cells. White arrowheads indicate large ring-like DSTYK-positive structures. b Double immunofluorescent staining of endogenous DSTYK with LAMP1 in COS-7 cells. c COS-7 cells transfected with DSTYK-V5 and double immunofluorescent staining of V5 with LAMP1 (top) and Rab7a (bottom). White arrows indicate large ring-like structures co-localization of DSTYK-V5 with LAMP1 and Rab7a. d Confocal images show the 2.5 dpf mosaic transgenic fishes expressing dstyk-GFP and LAMP1-mCherry (Tg(hsp70l:dstyk-GFP);Tg(hsp70l:LAMP1-mCherry)). Top panel show the single layer and bottom panel showed the 3D view. e Confocal images show the single layer of 2.5 dpf mosaic transgenic fishes expressing DSTYK-GFP and LAMP1-mCherry (Tg(hsp70l:DSTYK-GFP);Tg(hsp70l:LAMP1-mCherry)). Heat shocking at 72 hpf and imaging at about 78 hpf. f Representative images of LysoTracker Red staining of lysosome after transfected with control siRNA (top) and Dstyk siRNA (bottom) in COS-7 cells. g Quantifications of lysosome numbers after transfected with control siRNA or Dstyk siRNA. n = 10 independent views from three independent experiments, five cells were counted for each view. ***p < 0.001. p values were determined by unpaired two-tailed Student’s t-test. h Immunoblotting of LAMP1 and LAMP3 in COS-7 cells transfected with control siRNA and Dstyk siRNA. i Immunoblotting of Lamp1 and Lamp3 in WT and dstyk mutant zebrafish. Data are presented as mean ± SD. Scale bar represent 10 μm in (a–c), and (f), 100 μm in (d, e). Source data are provided as a Source Data file.
|