
Fig. 9-S1
- ID
- ZDB-FIG-180920-16
- Publication
- Lancino et al., 2018 - Anisotropic organization of circumferential actomyosin characterizes hematopoietic stem cells emergence in the zebrafish
- Other Figures
- All Figure Page
- Back to All Figure Page
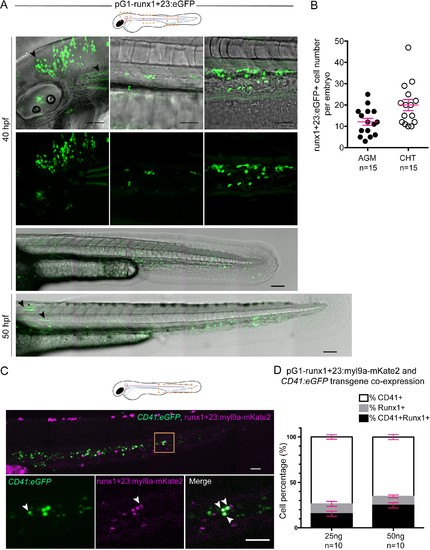
The runx’1 + 23’ enhancer allows expression of Myl9 in hematopoietic stem cells (see also text). (A) Top panels; maximum projection of Z-planes of the head, AGM and CHT (left to right) performed on a 40 hpf embryo expressing the runx’1 + 23’:eGFP transgene. Black arrows point at ectopic runx'1 +23':eGFP expression in neurons (observed in a minority of embryos), and muscle fibers. Scale bars, 50 μm. Bottom panels show trunks and tails of 40 hpf or 50 hpf embryo expressing the runx’1 + 23’:eGFP transgene in the AGM (area of HSC emergence) and in the CHT (Caudal Hematopoietic Tissue). Scale bars, 50 μm. (B) Quantification of eGFP expressing cells in the AGM or the CHT of 40 hpf embryos (n = 15 embryos; similar results were obtained at 50 hpf). Red bars represent Mean ± SEM. (C) Maximum projection of Z-planes of the CHT performed on a 48 hpf Tg(CD41:eGFP) embryo expressing the runx'1 +23':Myl9a-mKate2 transgene. Bottom panels correspond to the region highlighted by the yellow box and the white arrowheads point at eGFP (left panel), Myl9a-mKate2 (middle panel) and eGFP/Myl9a-mKate2 co-expressing cells (right panel). Scale bars, 50 μm. (D) Quantification of eGFP (%CD41+), Myl9a-mKate2 (%Runx1+) or eGFP/Myl9a-mKate2 (%CD41+Runx1+) expressing cells, according to the amount of injected DNA plasmid (n = 10 embryos). Red bars represent Mean ± SEM. |