
Fig. 6
- ID
- ZDB-FIG-180920-11
- Publication
- Lancino et al., 2018 - Anisotropic organization of circumferential actomyosin characterizes hematopoietic stem cells emergence in the zebrafish
- Other Figures
- All Figure Page
- Back to All Figure Page
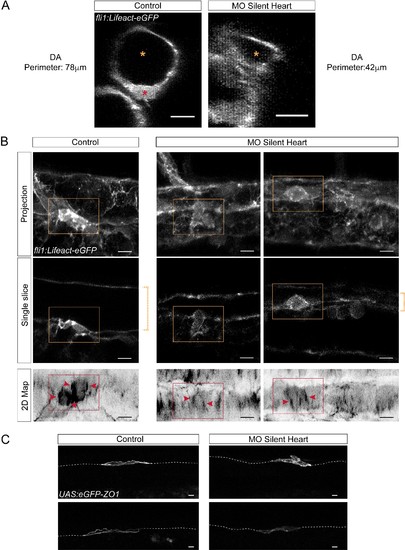
Blood flow influences the morphology as well as the cytoskeletal and junctional organization of hemogenic and emerging cells. Lifeact-eGFP (A,B) or eGFP-ZO1 (C) expressing 48 hpf embryos (A,B) were imaged by confocal microscopy after injection of sih or control morpholinos. (A) Transversal views of control and sih morphants show the flattening of the aorta and the decrease in perimeter when blood flow is abrogated. Yellow stars indicate the aortic lumen and the red star an EHT cell emerging from the ventral floor. (B) Maximum projections of Z-planes (top panels), single Z planes (middle panels and see Figure 6—video 1), or 2D-map projections (lower panels). Dashed yellow brackets highlight the thickness of the aorta. Yellow rectangles surround EHT undergoing cells. The same cells visualized after 2D projections are surrounded by red rectangles. Red arrowheads point at actin densification, in EHT cells, aligned with the antero-posterior axis of the dorsal aorta. (C) Maximum projections showing eGFP-ZO1 localization in two hemogenic control and sih morphants cells lying on the aortic floor. Note the mosaicism owing to transient expression of the UAS:eGFP-ZO1 transgene (for a 3D-rendering view and visualizing the aortic contours, see Figure 6—video 3). Dashed lines indicate the position of the aortic floor. Scale bars, 10 μm. |