Fig. 2
|
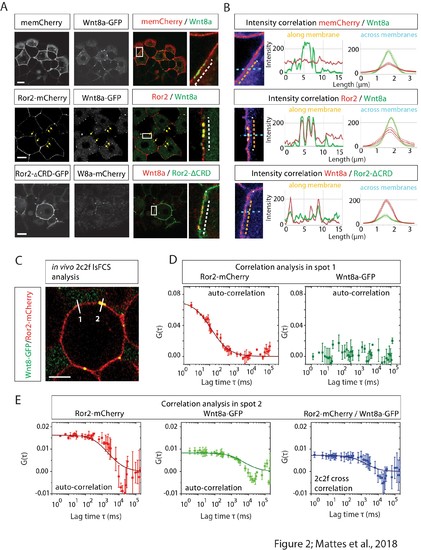
Image-based protein interaction analysis highlights Ror2s involvement in Wnt8a binding and cluster formation. (A) At the 8–16 cell stage, single blastomeres of zebrafish embryos were microinjected with 25 ng/µl mRNA of the indicated constructs to generate cell clones at 50% epiboly for confocal microscopy analysis. The imaging visualizes the co-localization of proteins in a single confocal plane including high-magnification of clusters. (B) A co-localization channel, obtained using fire LUT, and the intensity plot profile were generated in ImageJ. The intensity plots show one individual measurement along the membrane (left plot, orange arrows) and the average of measurements across the membrane including the SEM (right plot, light blue arrows). The graphs represents 10 membrane clusters acquired from five different cells of two different embryos per treatment. (C) Close-up of a 6–8 hpf live zebrafish embryos showing schematically how two-color two-foci line-scanning fluorescence correlation spectroscopy (2c2f lsFCS) data were collected by laser scanning perpendicular to the membrane (white lines) to collect data in the absence (spot 1) or presence (spot 2) of Wnt8a-GFP. Embryos were mounted in agarose and injected with Wnt8a-GFP and Ror2-mCherry. (D) Autocorrelation functions of Ror2-mCherry (red) and Wnt8a-GFP (green) (symbols) and model fit (line) measured in spot 1. The total time of the measurements was 390 s. Importantly, there is no Wnt8a-GFP at this position, as shown by the lacking autocorrelation in the green channel. Error bars represent standard deviations from two measurements. (E) Autocorrelation functions of Ror2-mCherry (red) and Wnt8a-GFP (green) and the dual-color cross-correlation (blue) (symbols) and model fits (lines) measured in spot 2. Here, Wnt8a-GFP is present, and a high cross-correlation amplitude indicates co-diffusion of bound Ror2-mCherry and Wnt8a-GFP. Error bars indicate standard deviations from two measurements. |

