
Fig. 5
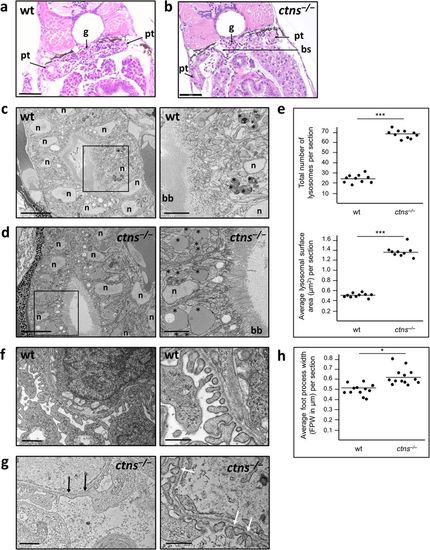
(a) H&E stained cut-section of a 6 dpf wt larva at the level of the glomerulus and proximal tubules (bar = 50 μm). (b) H&E stained cut-section of a 6 dpf ctns−/− larva at the level of the glomerulus and proximal tubules showing no apparent abnormality (bar = 50 μm). (c) Block face scanning EM image of the proximal tubule of a 4 dpf wt larva (bar = 5 μm). Demarcated area was magnified (right) to show size and distribution of lysosomes (asterisks) in the wt (bar = 2 μm). (d) Block face scanning EM image of the proximal tubule of a 4 dpf ctns−/− larva showing intact brush border (bar = 5 μm). Demarcated area was magnified (right) to show larger number of lysosomes (asterisks) many of which were significantly enlarged in size compared to the wt (bar = 2 μm). (e) Quantitation of the number and surface area of lysosomes in cut sections at the level of proximal tubules in both genotypes. (f) Transmission EM image of the glomerulus of a 6 dpf wt larva showing normal foot processes (bar = 2 μm). A magnified EM image (right) of podocytes of 6 dpf wt larva showing preserved podocytes slit diaphragms (bar = 1 μm). (g) Transmission EM image of the glomerulus of a 6 dpf ctns−/− larva showing partial foot process effacement (black arrows) (bar = 2 μm). A magnified EM image (right) of podocytes of 6 dpf ctns−/− larva showing narrowed podocyte slit diaphragmatic spaces (white arrows) (bar = 1 μm). (h) Quantitation of podocyte foot process width (FPW) in cut sections at the level of the glomerulus in both genotypes. bb, brush border; bs, Bowman’s space; g, glomerulus; n, nucleus; pt, proximal tubule. *P < 0.05, ***P < 0.001 between the 2 genotypes using student’s t test. |
| Fish: | |
|---|---|
| Condition: | |
| Observed In: | |
| Stage Range: | Day 4 to Day 6 |