
Fig. 5
- ID
- ZDB-FIG-180724-11
- Publication
- Janjuha et al., 2018 - Age-related islet inflammation marks the proliferative decline of pancreatic beta-cells in zebrafish
- Other Figures
- All Figure Page
- Back to All Figure Page
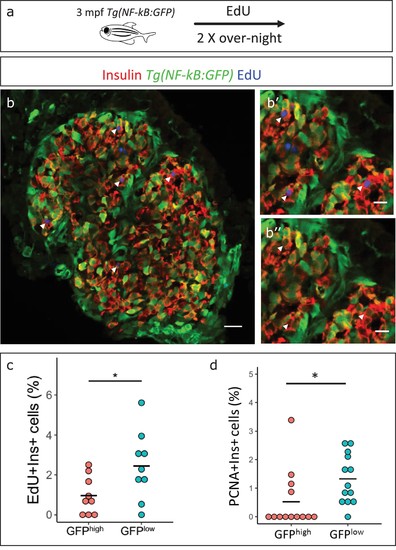
NF-kB:GFPhigh beta-cells proliferate less than their neighbors. (a) Schematic showing the EdU (5-ethynyl-2′-deoxyuridine) incorporation assay. Tg(NF-kB:GFP) animals were incubated in EdU at 3 mpf for two consecutive nights and fed during each day. (b) EdU incorporation assay was performed to mark the proliferating beta-cells in Tg(NF-kB:GFP) animals at 3 mpf. The confocal image (single plane) shows an overview of a section through the islet. Beta-cells were labeled with an insulin antibody (red), a GFP antibody (green) and EdU (blue). Arrowheads point to EdU-positive beta-cells. (b’–b’’) The insets show higher magnification images with and without the EdU channel. EdU incorporation can be observed in some of the GFPlow cells (white arrow-heads). (c) An insulin-positive cell was first located by going through individual sections in the confocal z-stack. The optical section containing the largest area of the nucleus was chosen as the center of the cell. A region-of-interest (ROI) was drawn around the nucleus and the fluorescence intensities of the GFP and DAPI channels were recorded. The normalized GFP intensity was calculated as a ratio of mean GFP intensity and mean DAPI intensity for each ROI. The average total normalized GFP-intensity of each islet was set as a threshold for dividing the cells into GFPhigh and GFPlow populations. The graph shows the percentage of EdU and insulin double-positive cells among the GFPhigh and GFPlow populations. Each dot represents one islet (n = 9). Horizontal bars represent mean values (two-tailed t-test, *p<0.05). (d) The graph shows the percentage of PCNA and insulin double-positive cells among the GFPhigh and GFPlow populations. Each dot represents one islet (n = 13). Horizontal bars represent mean values (two-tailed t-test, *p<0.05). See also Figure 5—figure supplement 2 for representative PCNA antibody staining. |