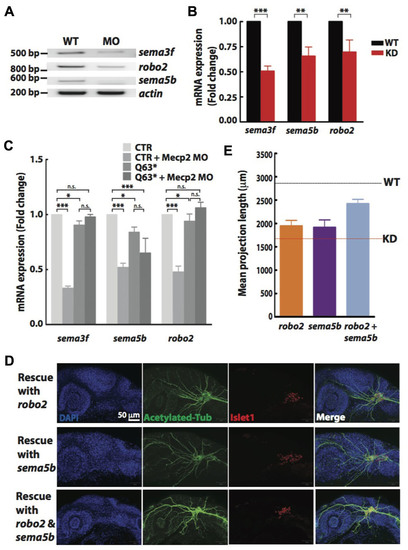
FIGURE 5. Sema5b and Robo2 rescue Mecp2-induced defects in axonal projections in TG. Representative gel images showing sema3f, sema5b and robo2 mRNA levels regulated by Mecp2 (A). Graph presenting quantitative RT-PCR of the three above mentioned genes in WT or Mecp2 MO injected embryos (B). Graph showing expression of sema3f, sema5b and robo2 mRNA in CTR and mecp2Q63∗/Q63∗ mutants using RT-PCR (C). Data are presented as fold expression of each gene normalized with housekeeping gene, beta-actin to value 1. (∗P < 0.05, ∗∗P < 0.01, ∗∗∗P < 0.001, two-way ANOVA with Bonferroni’s post hoc test). Sema5b and Robo2 rescue axonal projection of TG cells. Representative images showing peripheral projections of trigeminal sensory neurons in embryos injected with mecp2 MO together with mRNA of Sema5b, Robo2 or both (D). Quantitative analysis of total peripheral projections from trigeminal sensory neurons, with graph presenting total length of peripheral projections from trigeminal ganglia per zebrafish (E) (Blue – DAPI, Green – acetylated tubulin, Red – islet1). N > 10 in each group, Scale bar = 50 μm.
|
