
Fig. 2
- ID
- ZDB-FIG-171106-29
- Publication
- Leong et al., 2015 - Methyl-CpG Binding Protein 2 (Mecp2) Regulates Sensory Function Through Sema5b and Robo2
- Other Figures
- All Figure Page
- Back to All Figure Page
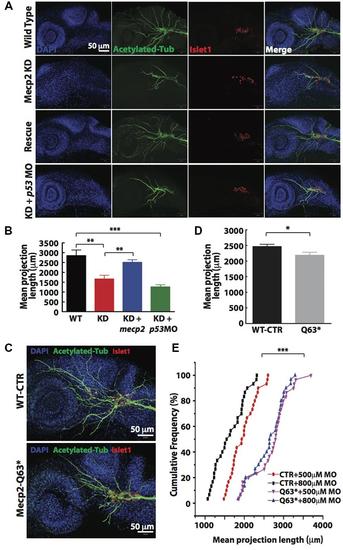
FIGURE 2. Knockdown of Mecp2 affects the axonal projection of trigeminal ganglion (TG) cells. Structure of peripheral dendritic projection and nerve pathways revealed by axon marker, acetylated tubulin (green), a general nucleus marker, DAPI (blue) and a neuronal marker, islet1 (red) at 24 hpf (A). Representative images showing peripheral axonal projections from sensory neurons of TG in wild-type controls (WT, top panel), Mecp2 morphants (second panel from top), Mecp2 morphants rescued by coinjecting mRNA of Mecp2 (third panel from top) and Mecp2 morphants coinjected with p53 MO (lower panel) (A). Quantitative analysis of total peripheral projections of trigeminal sensory neurons, with graph presenting total length of peripheral projections from trigeminal ganglia per zebrafish (B) N > 10. Representative images showing peripheral axonal projections from sensory neurons of TG in wild-type controls (WT, top panel) and mecp2Q63∗/Q63∗ mutants (Mecp2-Q63, bottom panel) (C). Graph showing quantitative analysis of peripheral projections (total length) from trigeminal ganglia per zebrafish in wild-type controls and mecp2Q63∗/Q63∗ mutants (D). Graph showing total neurite length of controls (CTR) and mecp2Q63∗/Q63∗ mutants (Q63) injected with either 500 or 800 μM of mecp2 MO (E). Scale bar = 50 μm. Each individual dot on graph (E) represents individual embryos. N = 30 in each group. (∗P < 0.05, ∗∗P < 0.01, ∗∗∗P < 0.0001, student t-test for (D) and one-way ANOVA with Bonferroni’s post hoc test for (B,E)]. |
| Fish: | |
|---|---|
| Knockdown Reagents: | |
| Observed In: | |
| Stage: | Prim-5 |