
Fig. 4
- ID
- ZDB-FIG-170823-4
- Publication
- Walderich et al., 2016 - Homotypic cell competition regulates proliferation and tiling of zebrafish pigment cells during colour pattern formation
- Other Figures
- All Figure Page
- Back to All Figure Page
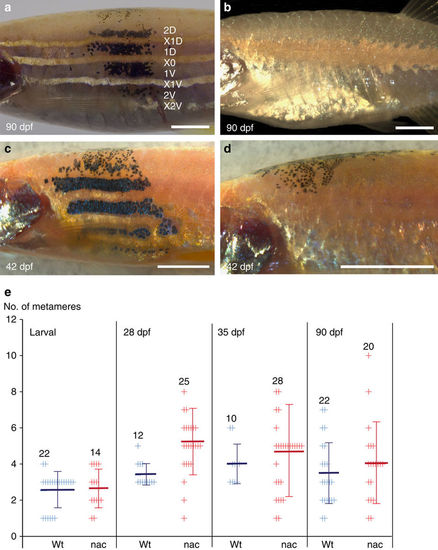
Transplanted melanophore clusters in control (albino) and nacre chimeras. The organization of wild-type melanophores (black) in (a) albino and (c,d) nacre hosts. Adult nacre fish lacking melanophores (b). Scale bars, a–d: 250 μm. (e) Quantification of the number of metamers occupied by wild-type melanophores in the body stripes in albino control (blue) and nacre (red) hosts. The number of clusters analysed is depicted in the graph. Student’s t-test (Welsh corrected) revealed significant differences between the size of wild type and nacre melanophore clusters at 28 dpf: (wild type, n=12 clusters, 7 fishes; nacre, n=25 clusters, 17 fishes, P≤0.0002), at larval stages: (wild type, n=22 clusters, 10 fishes; nacre, n=14 clusters, 20 fishes, P=0.7892), 35 dpf: (wild type, n=10 clusters, 6 fishes; nacre, n=28 clusters, 17 fishes, P=0.2512 and adult (>90 dpf): (wild type, n=22 clusters, 9 fishes; nacre, n=20 clusters, 17 fishes, P=0.3840) no significant difference could be shown. Horizontal lines in dark blue (wild type) and red (nacre) indicate the mean value and the error bars represent standard deviation. Student’s t-test (Welsh corrected) was used to determine the P-value. |