
FIGURE
Fig. 4
Fig. 4
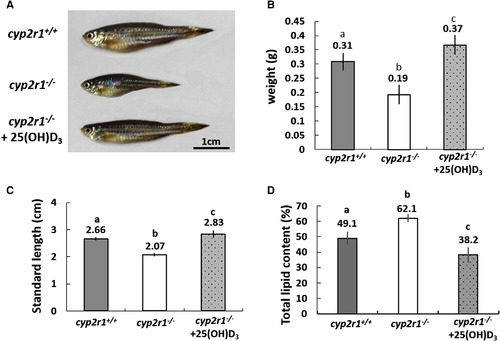
25(OH)D3 Rescue Experiments (A–D) Shown here: (A) the morphological features, (B) body weight, (C) standard length, and (D) total lipid contents of wild-type control, cyp2r1 mutant, and 25(OH)D3-treated cyp2r1 mutant fish at 100 dpf. N = 11. Error bars indicate means ± SD. The different letters above the bars indicate a significant difference at p < 0.01. |
Expression Data
Expression Detail
Antibody Labeling
Phenotype Data
| Fish: | |
|---|---|
| Condition: | |
| Observed In: | |
| Stage: | Adult |
Phenotype Detail
Acknowledgments
This image is the copyrighted work of the attributed author or publisher, and
ZFIN has permission only to display this image to its users.
Additional permissions should be obtained from the applicable author or publisher of the image.
Full text @ Cell Rep.