
Fig. 4
- ID
- ZDB-FIG-161116-23
- Publication
- Liu et al., 2016 - A High-Content Larval Zebrafish Brain Imaging Method for Small Molecule Drug Discovery
- Other Figures
- All Figure Page
- Back to All Figure Page
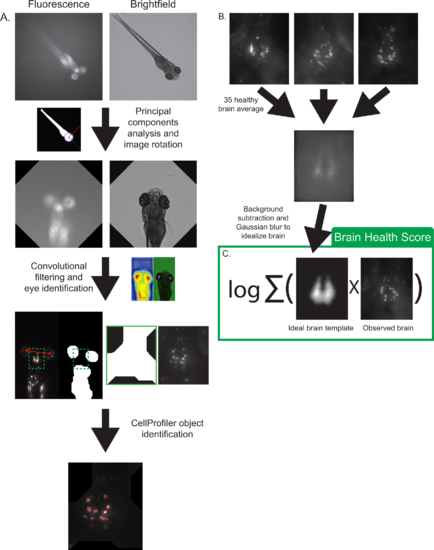
Image processing pipeline. (A) The fluorescence image is thresholded and a principal component analysis is used to rotate both images to a head-up position. The brightfield image is then thresholded and convolved with an eye-like filter to locate the eyes. The brain region is then identified using the eyes as landmarks, the image is cropped, and a maximum intensity z-projection is exported to CellProfiler for neuron identification. Red asterisks denote centroids of identified eye regions and the green box represents the final cropped area sent to CellProfiler for analysis. (B) Creation of an idealized brain template image. 35 healthy brains were registered and averaged in ImageJ. Background was subtracted and a Gaussian blur filter was applied to smooth and idealize the image. (C) The brain health score was defined as the logarithm of the covariance between an idealized brain template and an observed brain image. |