Fig. 2
|
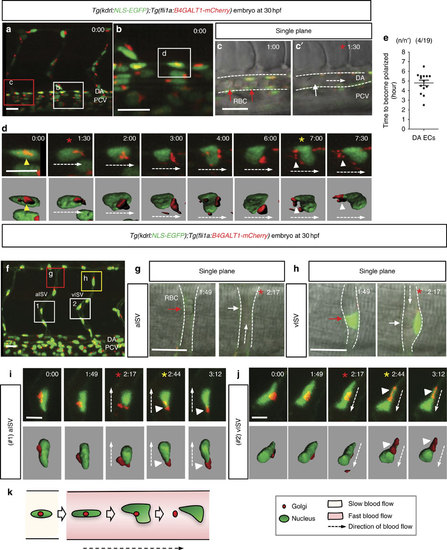
EC polarization by blood flow. (a-d) Three-dimensional-rendered confocal stack images of the trunk region of 30 h.p.f. Tg(kdrl:NLS-EGFP);Tg(fli1a:B4GALT1-mCherry) embryos. White box in a is enlarged in b and single plane images of red boxed region in a is enlarged in c and c′. (c,c′) At t=60 min, RBCs (red arrows) in the DA are mainly stationary, whereas by 90 min they are moving too fast to be clearly distinct (white arrow). Red asterisks indicate the time when vigorous circulation starts. (d) Confocal time-lapse images of EC in the white box in b. Surface-rendered images are displayed below. Yellow asterisk indicates the time when the EC is polarized. Time (hours:minutes) is shown in the top right corner of the images. (e) Quantification of time required for DA ECs to become polarized starting at 30 h.p.f. and at 28.5 °C. Numbers of larvae (n) and ECs (n′) indicated above the graph. Error bars represent s.e.m. (f-j) Three-dimensional-rendered confocal stack images of the trunk region of 30 h.p.f. Tg(kdrl:NLS-EGFP);Tg(fli1a:B4GALT1-mCherry) embryos. (g,h) Red and yellow boxes in f is enlarged in g and h. White dashed arrows indicate direction of blood flow. White dashed lines indicate ISV boundaries. (g) Red arrow points to stationary RBCs in the SeA; white arrow denotes apparent absence of RBCs. (h) At t=1:49, lumen formation does not appear to be completed (red arrow), whereas at t=2:17, a lumen appears to be formed (white arrow). (i,j) Time-lapse images of ECs marked with numbers (1 (i) and 2 (j)) in f. White dashed arrows indicate direction of blood flow. White arrowheads point to polarized Golgi apparatus. Red asterisks indicate the time when vigorous circulation starts. Yellow asterisks indicate the time when the EC is polarized. Time (hours:minutes) is shown in the top right corner of the images. (k) Schematic model showing the process of EC polarization by blood flow. Anterior to the left, dorsal to the top. Scale bars, 20 µm (a-c,f-h), 7 µm (d,i,j). aISV, arterial intersegmental vessel; DA, dorsal aorta; PCV, posterior cardinal vein; vISV, venous intersegmental vessel. Error bars, s.e.m. |
| Genes: | |
|---|---|
| Fish: | |
| Anatomical Terms: | |
| Stage: | Prim-15 |

