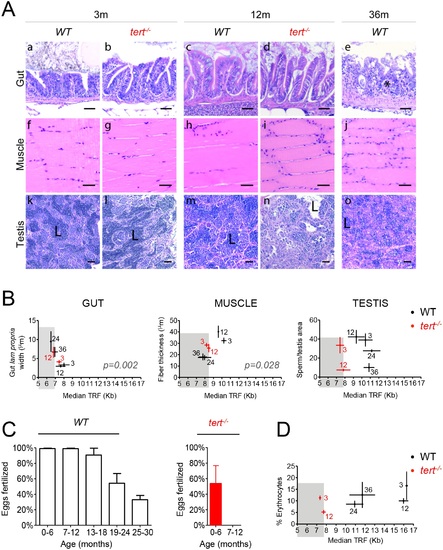
Telomere shortening culminates in tissue defects associated with aging.tert-/- siblings. By 12 months of age, tert-/- mutants (N = 3) show inflammatory cell infiltration of the lamina propria of the gut (panel b, d), myocyte atrophy and degeneration (characteristic of sarcopenia—panels i), and reduced numbers of mature spermatozoa (panels l, n). Similarly, by 36 months, WT show similar lesions in the gut (N = 5, panels e) and muscle (N = 5, panels j); and with aging, WT testis show a gradual decrease in the number of spermatozoa (panels k, m, o, N = 5). B) Among these age-related histological lesions, intestinal inflammation and sarcopenia correlate with shortening of mTL (p = 0.002 and p = 0.028, respectively), while no correlation is found for reduction in mature spermatozoa numbers. Grey shaded area identifies the median telomeric length at which significant intestinal inflammation, sarcopenia and defects in production of mature spermatozoa are observed in tert-/- mutants. WT and tert-/- age groups are indicated in each graph by black and red colored numbers, respectively. C) In accordance with lower levels of spermatozoa production at later ages, WT show a decreased ability to successfully fertilize female eggs from 24 months of age onwards (N = 4). tert-/- have impairment of reproductive ability by 6 months and complete lack of function by 12 months (N = 3). D) Erythrocyte levels (N = 5) decrease with aging in WT and tert-/- mutants’ kidney marrow, indicative of anemia, but this is not predicted by mTL decline in this tissue. Grey shaded area identifies the median telomeric length at which a significant decrease in erythrocyte levels is observed in tert-/- mutants. Scale bar = 50 µm. N = 3–6 for tissue mTL quantifications per genotype per time point (x-axis in graphs of Fig 4B and 4D). Data are represented as mean +/- SEM.
|

