
FIGURE
Fig. 3 S1
- ID
- ZDB-FIG-160205-37
- Publication
- Hesse et al., 2015 - The human ARF tumor suppressor senses blastema activity and suppresses epimorphic tissue regeneration
- Other Figures
- All Figure Page
- Back to All Figure Page
Fig. 3 S1
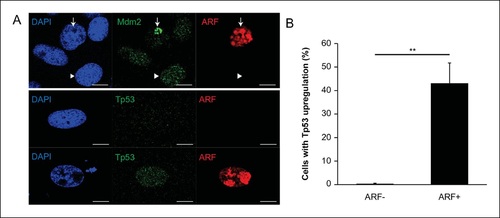
Analysis of ARF expression in zebrafish cells. (A) Immunofluorescence for Mdm2 and ARF (top) and Tp53 (bottom) in zebrafish cells (ZKS) transfected with pcDNA-ARF. ARF and Mdm2 co-localize in the nucleolus (arrow) when ARF is expressed; in cells without ARF, Mdm2 has a diffuse nuclear staining pattern (arrow head; top). Tp53 upregulation depends on ARF expression (bottom). Scale bars: 10 µm. (B) Quantification of Tp53 upregulation in zebrafish cells (ZKS) transfected with pcDNA-ARF (N = 100, p<0.01). Results are shown as mean ± standard deviation. |
Expression Data
Expression Detail
Antibody Labeling
Phenotype Data
Phenotype Detail
Acknowledgments
This image is the copyrighted work of the attributed author or publisher, and
ZFIN has permission only to display this image to its users.
Additional permissions should be obtained from the applicable author or publisher of the image.
Full text @ Elife