
Fig. 4
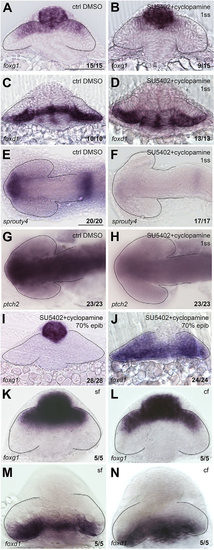
NT patterning is restored upon combined abrogation of both Fgf and Hh signals. Expression of foxg1 (A,B,I,K,L), foxd1 (C,D,J,M,N), sprouty4 (E,F) and ptch2 (G,H) in in the conditions specified in the panels. A-D,I-N are frontal views; E-H are dorsal views with anterior to the left. All are zebrafish embryos at 10-12ss, except for those in K-N, which are cavefish (cf) and surface fish (sf) forms of Astyanax mexicanus. Scale bars: 100µm. Numbers in the bottom-right of each panel indicate the number of embryos with the phenotype shown out of the total number of embryos analysed. Dashed lines outline the forebrain (dorsal views) or the optic vesicles (frontal views). |