
Fig. S7
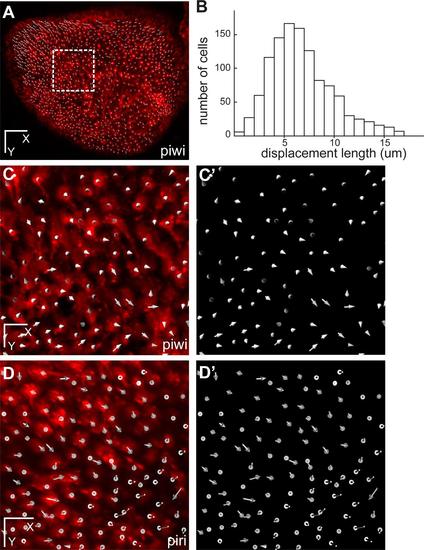
Absence of migration of pallial RG cells. (A) Dorsal view of the entire pallial germinal zone of one telencephalic hemisphere in a transgenic zebrafish her4:dRFP into a casper background (individual fish named piwi) at t=0, where all individual RG cells have been plotted (white dots, 1,122 cells). (B) Distribution of the total displacement length of each of the 1,122 cells after 7 days of imaging. The gaussian curve, with an average displacement of 6.59 µm (SD=2.4) does not reveal outlier cells (Grubbs′ test). (C,C′) Overall displacement vector of each individual cell after 7 days of imaging in the area boxed in A (C: vectors shown on top of red fluorescence –RG cells-, C′: vectors only). Note in C that the average displacement of each cell rarely exceed the size of a cell diameter. (D,D′) Same representations as (C,C′) but for an equivalent area in the individual fish named piri. Of note, in the case of a division, daughter cells, which always remain adjacent (see Fig. 2), have been plotted as a single cell. Scale bars: 80 µm (A), 20 µm (C-D′). |