
Fig. S6
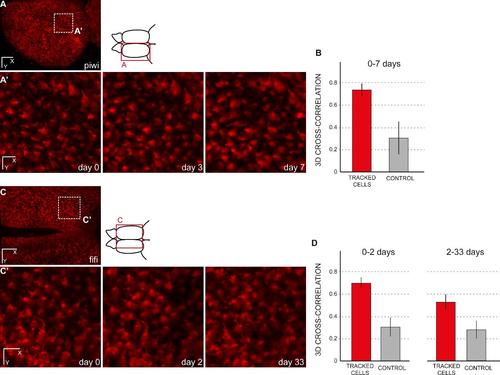
Cross-correlation of randomly chosen cells between time points. (A,A′) Dorsal general view and close up for three time points (until 7 days) of a transgenic zebrafish her4:dRFP into a casper background (individual fish named piwi). (A′) shows the result for the area boxed in A after a manual re-alignement using the drift correction in the Imaris software (Bitplane). (B) Amplitude of 3D image cross-cross correlations of 100 tracked cells between day 0 and day 3 or between day 3 and day 7. The average correlation of tracked cells is significantly higher than the control case, when the same analysis is performed after random permutation of cell positions (Welch’s test, p=1.2 10-118). (C,C′) Dorsal general view and close up for three time points (until 33 days) of a transgenic zebrafish her4:dRFP into a casper background (individual fish named fifi). (C′) shows the result for the area boxed in A after a manual re-alignement using the drift correction in the Imaris software (Bitplane). (D) Amplitude of 3D image cross-cross correlations of 11 tracked cells between day 0 and day 2 (left) and between day 2 and day 33 (right). As expected, the correlation amplitude decreases for longer delay between time points (here, from 0.70 for 2 days, to 0.53 for 31 days). However, in both cases the average correlation of tracked cells remains significantly higher than the control case, when the same analysis is performed after random permutation of cell positions (Welch’s test, p= 5.1 10-10 and p=1.7 10-7, respectively). Scale bars: 80 µm (A, C), 20 µm (A′, C′) |