
Fig. 9
- ID
- ZDB-FIG-150511-7
- Publication
- Lagman et al., 2015 - Transducin Duplicates in the Zebrafish Retina and Pineal Complex: Differential Specialisation after the Teleost Tetraploidisation
- Other Figures
- All Figure Page
- Back to All Figure Page
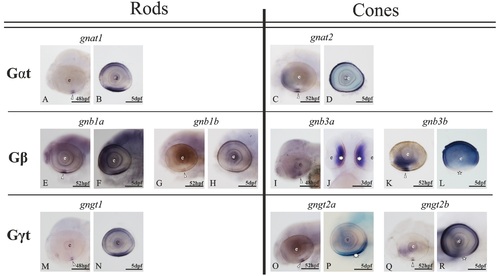
Summary of transducin gene ontogeny in the zebrafish retina. Photomicrographs of zebrafish larvae from 48 hpf to 5 dpf showing the onset and development of the expression for each transducin gene in the retina. All the pictures are lateral views with the rostral part to the left, except for panel J which shows a ventral view. Some eyes were dissected from the larvae for better visualisation of the staining (B, D, K, L and N). Expression is first observed in the ventral retina (arrowheads) for all genes, in accordance to cell differentiation: gnat1 (A), gnat2 (C), gnb1a (E), gnb1b (G), gnb3a (I), gnb3b (K), gngt1 (M), gngt2a (O) and gngt2b (Q). For each gene, a later stage reveals the increase in the number of positive cells: panels B, D, F, H, J, L, N, P and R, respectively. Note the similar ontogenetic pattern for gnb1a (E, F) and gnb1b (G, H), although with weaker staining for the second, and the background-like staining along the head. In addition, note that the compartmentalisations in adults are already observable at 5 dpf: exclusively ventral expression of gngt2a (asterisk in P) as well as absence of ventral expression for the gnb3b (star in L) and gngt2b (star in R). The gnb3a expression can be observed in the whole retina; however, panel J only shows the expression at 3 dpf in the ventro-medial retina (asterisks). Scale bars: 50 µm. For abbreviations see Fig. 2 legend. |
| Genes: | |
|---|---|
| Fish: | |
| Anatomical Terms: | |
| Stage Range: | Long-pec to Day 5 |