FIGURE
Fig. 1
- ID
- ZDB-FIG-150506-23
- Publication
- Sasore et al., 2014 - Deciphering Combinations of PI3K/AKT/mTOR Pathway Drugs Augmenting Anti-Angiogenic Efficacy In Vivo
- Other Figures
- All Figure Page
- Back to All Figure Page
Fig. 1
|
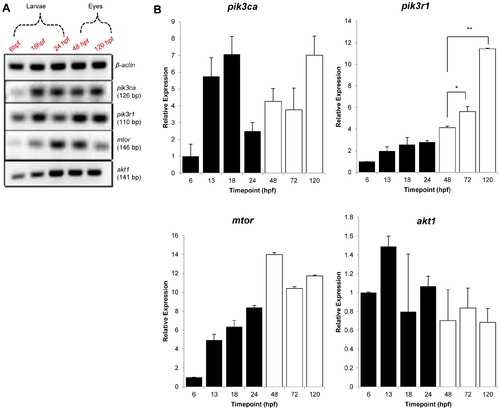
PI3K/Akt/mTOR gene expression in developing Tg(fli1:EGFP) zebrafish. (A) RT-PCR and (B) qPCR examined the mRNA levels of zebrafish pik3ca, pik3r1, mTOR and akt1 genes. Embryos were harvested at 6, 13, 18 or 24 hours post fertilization (hpf) and eyes at 48, 72 or 120 hours post fertilization (hpf). (A). Relative expression, normalised to 18S rRNA, of pik3ca, pik3r1, mTOR and akt1 mRNA levels in developing zebrafish embryos (black columns) and eyes (white columns) expressed relative to the 6 hpf stage. Results are expressed as mean ± S.D. (n = 3), *P<0.05, **P<0.01. |
Expression Data
| Genes: | |
|---|---|
| Fish: | |
| Anatomical Terms: | |
| Stage Range: | Shield to Day 5 |
Expression Detail
Antibody Labeling
Phenotype Data
Phenotype Detail
Acknowledgments
This image is the copyrighted work of the attributed author or publisher, and
ZFIN has permission only to display this image to its users.
Additional permissions should be obtained from the applicable author or publisher of the image.
Full text @ PLoS One

