
Fig. 3
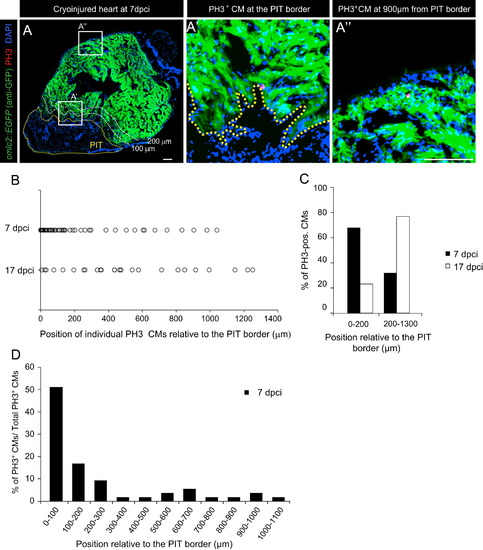
Spatio-temporal distribution of PH3-positive CMs reveals two regenerative patterns in response to myocardial infarction. (A) Representative section of the heart at 7 dpci that was used for mapping PH3-positive cells (red) in the myocardium (green) in respect to the post-infarcted tissue (PIT; encircled by the yellow dotted line). Two zones of the myocardium at a distance of 0-100 and 100-200 µm from the PIT border are indicated with white dotted lines that are labeled with 100 µm and 200 µm, respectively. (A′,A′′) Higher magnifications of the framed area in (A) showing PH3-positive cells at different distances from the PIT border. Scale bar (A, A′′)=100 µm. (B) Plot of the spatial distribution of PH3-positive CMs relative to the PIT border at 7 (n=53 cells) and 17 dpci (n=26 cells). (C) Fractions of PH3-positive CMs in the zones located in the proximity of PIT border (0-200 µm) or at distant locations from the site of injury (200-1300 µm) at 7 and 17 dpci. (D) Fractions of PH3-positive CMs in all the myocardial subdomains at 7 dpci demonstrate a graded distribution in the injury-abutting zone (0-200 µm) and an even distribution in the injury-remote zone (200-1300 µm). |
Reprinted from Developmental Biology, 399(1), Sallin, P., de Preux Charles, A., Duruz, V., Pfefferli, C., Jazwinska, A., A dual epimorphic and compensatory mode of heart regeneration in zebrafish, 27-40, Copyright (2015) with permission from Elsevier. Full text @ Dev. Biol.