
Fig. S4
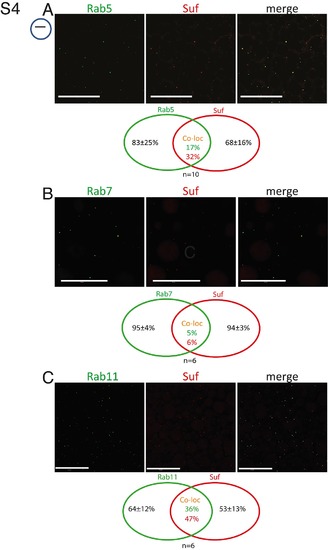
Single channels of Suf and Rab colocalization. Partial colocalization of Suf/Spastizin (red) with Rab-GTPases. (A) Rab5 (green) shows some colocalization with Suf. Venn diagram quantifying Rab5 and Suf costaining. Counting red, green and yellow foci of oocytes (n = 10) reveals that 83±25% Rab5 spots are negative for Suf and 68±16% Suf spots are negative for Rab5. Hence, 17% of the Rab5 positive vesicles contain Suf and 32% of the Suf positive vesicles Rab5. (B) Rab7 shows almost no colocalization with Suf, whereas Suf colocalizes with Rab11 vesicles more frequently (C). Scale bar: 50 µm. Small icon next to figures indicates the level of the optical section (black line) in the oocyte (blue circle). |