Fig. 1
- ID
- ZDB-FIG-140522-63
- Publication
- Almeida et al., 2014 - Spectrum of Fates: a new approach to the study of the developing zebrafish retina
- Other Figures
- All Figure Page
- Back to All Figure Page
|
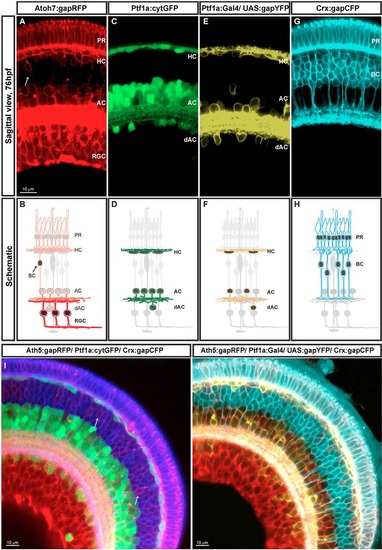
SoFa transgenic lines. Retina sagittal sections (76 hpf). Reporter protein expression profile and corresponding diagram of each of the four transgenes used to generate the SoFa lines (A-H). (A,B) gapRFP expression of Atoh7:gapRFP retinas. Arrow indicates Atoh7+ BCs. (C,D) cytGFP expression of Ptf1a:cytGFP retinas. (E,F) Variegated gapYFP expression of Ptf1a:Gal4/UAS:gapYFP retinas. (G,H) gapCFP expression of Crx:gapCFP retinas. SoFa fish were generated combining these individual transgenic lines. (I) In Sofa1 fish, which were generated by mating Atoh7:gapRFP, Ptf1a:cytGFP and Crx:gapCFP, retinal cells are labelled with a combination of membrane-tagged and cytoplasmic FPs. (H) In Sofa2 fish, which were generated by mating Atoh7:gapRFP, Ptf1a:Gal4/ UAS:gapYFP and Crx:gapCFP, all retinal cells are labelled with a membrane-tagged FP. PR, photoreceptors; HC, horizontal cells; BC, bipolar cells; AC, amacrine cells; dAC, displaced amacrine cells; RGC, retinal ganglion cells. |

