
Fig. 1
- ID
- ZDB-FIG-140314-2
- Publication
- Williams et al., 2013 - Developmental expression of the Nfe2-related factor (Nrf) transcription factor family in the zebrafish, Danio rerio
- Other Figures
- All Figure Page
- Back to All Figure Page
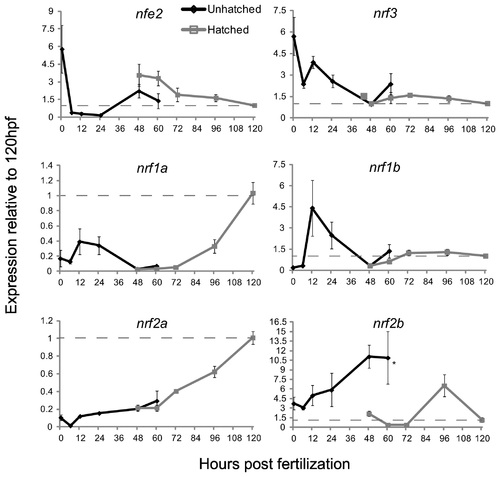
The expression of the nrf gene family during development as measured by quantitative real-time PCR. Black lines indicate expression pre-hatch and grey lines indicate expression post-hatch. Values were normalized to the 120 hpf time-point and β-actin 1 (actb1) was used as the housekeeping gene. Data are presented as the mean ± S.E.M. (error bars), and N = 4 pools of 30 embryos. Differences in expression between hatching state were assessed using ANOVA followed by Fisher′s PLSD (*, p ≤ 0.05). Data for expression of nrf2a and nrf2b are from Timme-Laragy et al. [7] and are used with permission of the American Society for Biochemistry and Molecular Biology. Previously these data were presented as molecule number. Here we have normalized the data to β-actin 1 expression and to the 120 hpf time point and re-plotted for comparison to the new data on expression of other nrf family genes. Dashed lines indicate the value of 1.0 from the 120 hpf time point. |
| Genes: | |
|---|---|
| Fish: | |
| Anatomical Term: | |
| Stage Range: | 1-cell to Day 4 |