
Fig. 1
|
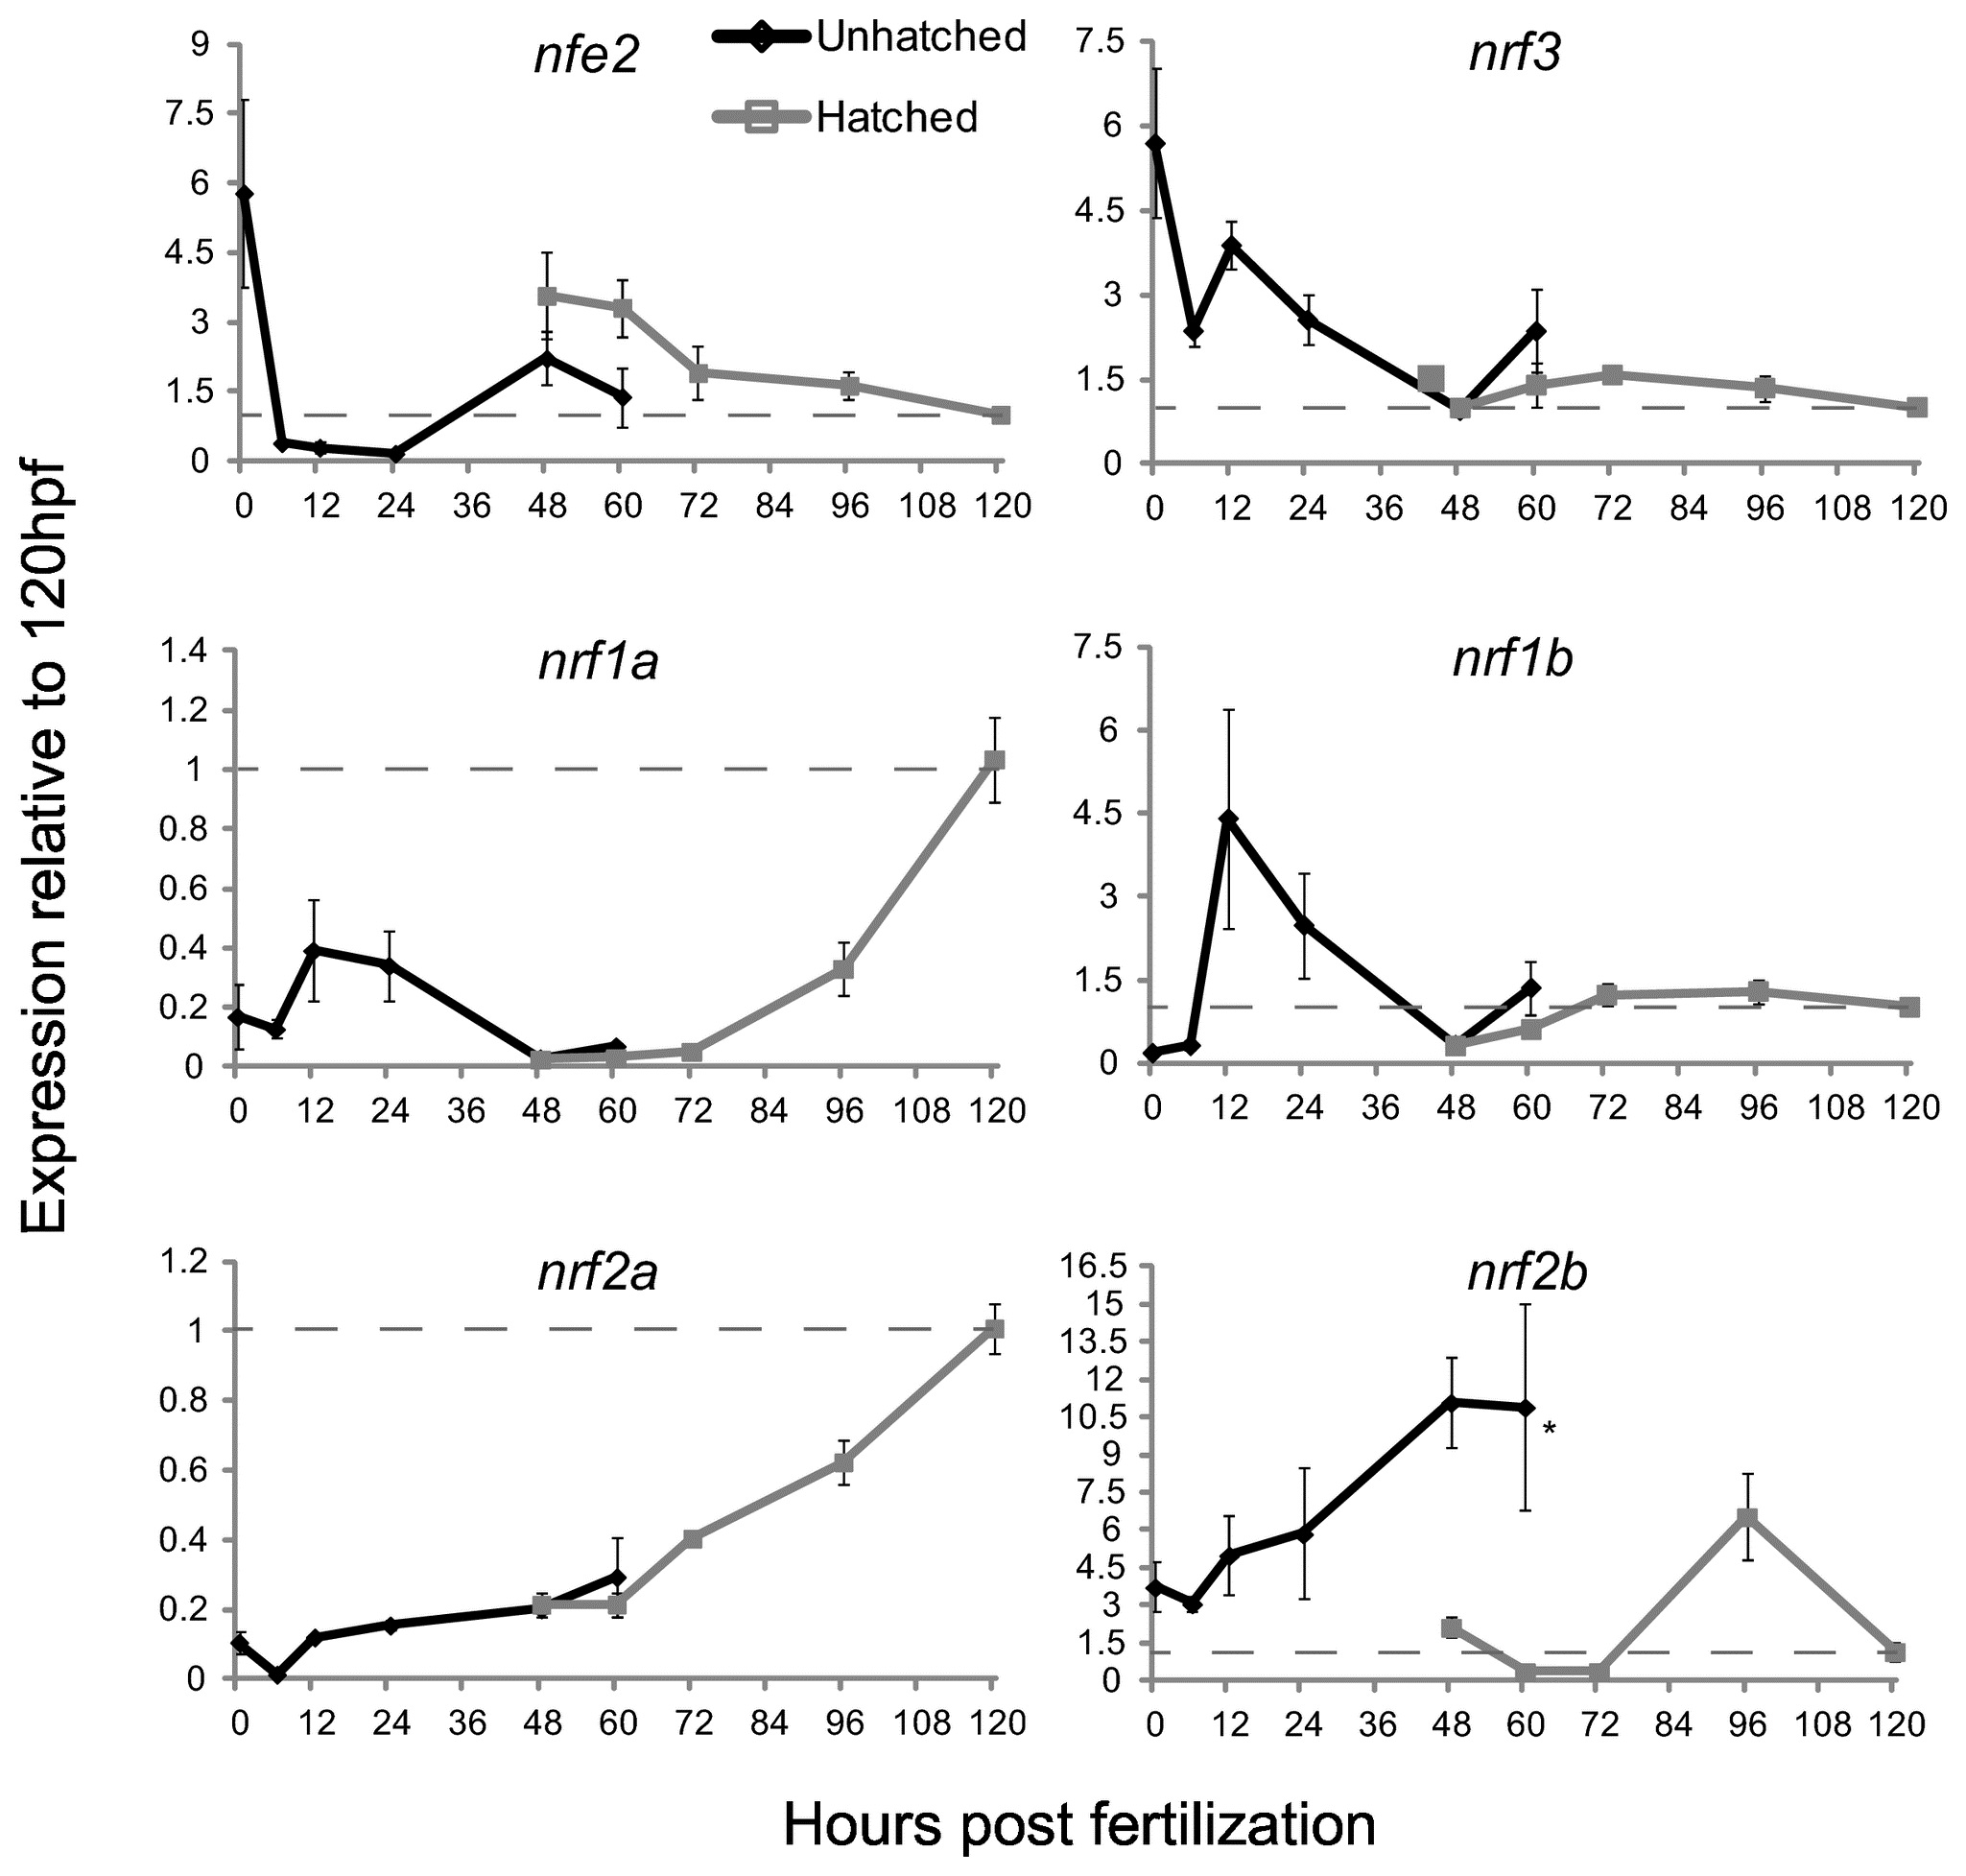
Fig. 1
The expression of the nrf gene family during development as measured by quantitative real-time PCR.
Black lines indicate expression pre-hatch and grey lines indicate expression post-hatch. Values were normalized to the 120 hpf time-point and β-actin 1 (actb1) was used as the housekeeping gene. Data are presented as the mean ± S.E.M. (error bars), and N = 4 pools of 30 embryos. Differences in expression between hatching state were assessed using ANOVA followed by Fisher′s PLSD (*, p ≤ 0.05). Data for expression of nrf2a and nrf2b are from Timme-Laragy et al. [7] and are used with permission of the American Society for Biochemistry and Molecular Biology. Previously these data were presented as molecule number. Here we have normalized the data to β-actin 1 expression and to the 120 hpf time point and re-plotted for comparison to the new data on expression of other nrf family genes. Dashed lines indicate the value of 1.0 from the 120 hpf time point.