Fig. 2
- ID
- ZDB-FIG-140107-55
- Publication
- Borovina et al., 2013 - IFT88 Plays a Cilia- and PCP-Independent Role in Controlling Oriented Cell Divisions during Vertebrate Embryonic Development
- Other Figures
- All Figure Page
- Back to All Figure Page
|
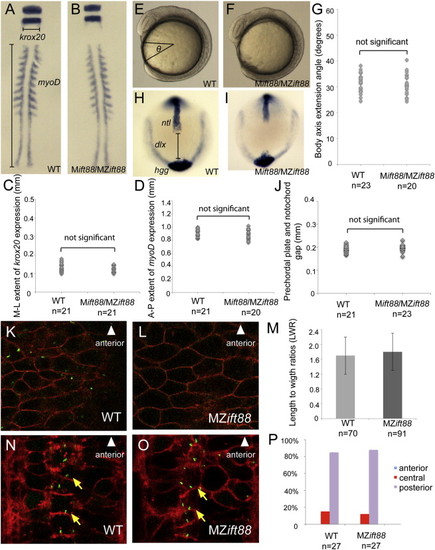
Cilia Are Not Required to Establish PCP (A–D) Whole embryo flat-mount RNA in situ hybridization of krox20 and myoD expression in representative ten-somite-stage WT (A) and Mift88 or MZift88 (B) embryos. Quantification of the mediolateral extent of krox20 (C; p = 0.06) and the anteroposterior extent of myoD expression (D; p = 0.21) demonstrated no significant differences in CE of the body axis between WT (n = 21) and Mift88 or MZift88 mutants (n = 21, krox20; n = 20, myoD). (E–G) Lateral DIC images of eight-somite-stage WT (E) and Mift88 or MZift88 (F) embryos. Quantification of the body axis extension angle (G) in WT (n = 23) and Mift88 or MZift88 mutants (n = 20) demonstrated no significant differences (p = 0.36). (H–J) Whole-mount RNA in situ hybridization of ntl, hgg1, and dlx expression in representative bud-stage WT (H; n = 21) and Mift88 or MZift88 (I; n = 23) embryos. Quantification of the gap between the prechordal plate and the notochord (J) revealed no significant differences (p = 0.1). (K–M) Confocal micrographs of WT (K) and MZift88 (L) dorsal ectoderm cells labeled with memb-mRFP (red) and Arl13b-GFP (green). (M) Graph of LWRs for WT (n = 70; 2 embryos) and MZift88 mutant (n = 91; 3 embryos) cells revealed no statistical differences (p = 0.25). Error bars in (M) represent SD. (N–P) Coronal section through the floor plate of 28–32 hpf WT (N) and MZift88 mutant (O) embryos expressing memb-mRFP (red) and Centrin-GFP (green) demonstrating basal body docking at the posterior apical surface (yellow arrows). (P) Quantification of WT (n = 27) or MZift88 (n = 27) cells displaying anterior (blue), central (red), and posterior (purple) position of basal bodies at the apical surface of floor-plate cells. Statistical significance for all experiments was determined using a Student’s t test and alpha was set as 0.05. |
| Genes: | |
|---|---|
| Fish: | |
| Anatomical Terms: | |
| Stage Range: | 5-9 somites to 10-13 somites |

