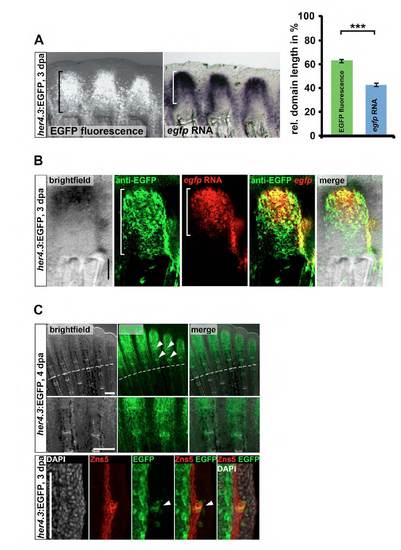
Fig. S2
|
Difference in transcript and protein expression pattern of the her4.3:EGFP reporter. (A) Length of the domain positive for EGFP fluorescence along the proximodistal axis is significantly larger than that of the domain positive for egfp RNA, as detected by whole-mount in situ staining in the same fins rays of her4.3:EGFP transgenics. In the right panel, the domain lengths relative to the length of the entire regenerate are plotted (2nd, 3rd and 4th lateral ray of each lobe was measured, n=5 regenerates, ***P<0.001 t-test). (B) EGFP protein-positive cells extend further proximally than egfp RNA-positive cells in her4.3:EGFP regenerates at 3 dpa. Confocal images of the fluorescent signal of Fast Red precipitates in whole-mount regenerates stained for egfp transcripts and of anti-GFP immunofluorescence. Scale bar: 100 μm. (C) EGFP fluorescence in her4.3:EGFP transgenic regenerates is detectable in the forming joint regions (arrowheads). Top panel: whole-mount image of 4 dpa regenerate. Bottom panel: confocal image of longitudinal sections of 3 dpa her4.3:GFP transgenic regenerates stained with anti-GFP antibody, anti-Zns5 antibody (labeling all osteoblasts) and DAPI. |

