Fig. 10
|
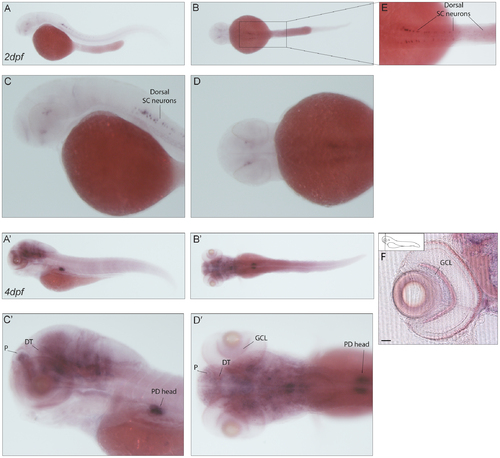
Expression pattern of caln1. (A–D2) In situ signal of caln1 transcript in 2dpf (A–D) and 4dpf (A2–D2) larvae. Lateral (A,C–A2,C2) and dorsal views (B,D–B2D2). (E) Higher magnification shows specific staining in the dorsal spinal cord probably in Rohon Beard cells. (A2–D2) 4dpf whole mount embryos show diffuse signal in the brain and a specific expression in what is most probably the head of the pronephric ducts. (F) A transverse section through the retina shows expression in the retinal ganglion cell layer. Scale bar: 50 µm. SC neurons: spinal cord neurons, P: pallium; DT: dorsal thalamus; PD: pronephric duct; GCL: ganglion cell layer. |
| Gene: | |
|---|---|
| Fish: | |
| Anatomical Terms: | |
| Stage Range: | Long-pec to Day 4 |

