
FIGURE
Fig. s2
Fig. s2
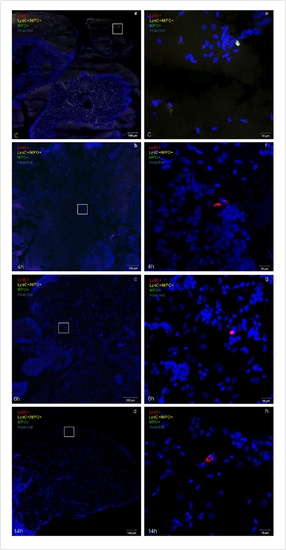
Brain inflammatory response induced by H/R in vivo. (a–h) Representative confocal microscopy images showing neutrophils (yellow or green fluorescence) and macrophages (red fluorescence) infiltration in double transgenic line Tg(MPO:EGFP)×Tg(LysC:DsRed) in control (C) and at different time points (4 h, 6 h, and 14 h) after H/R. Hoechst stains cell nuclei. (n = 3). (a–d) calibration bar = 100 µm, (e–h) calibration bar = 10 µm. |
Expression Data
Expression Detail
Antibody Labeling
Phenotype Data
Phenotype Detail
Acknowledgments
This image is the copyrighted work of the attributed author or publisher, and
ZFIN has permission only to display this image to its users.
Additional permissions should be obtained from the applicable author or publisher of the image.
Full text @ PLoS One