
Fig. 2
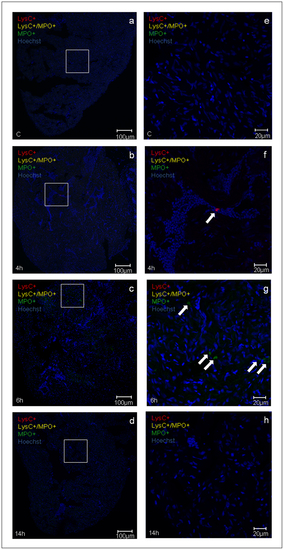
Inflammatory response induced by H/R in vivo. Representative confocal microscopy images (a-h) showing neutrophils (yellow fluorescence or green fluorescence) and macrophages (red fluorescence) infiltration in double transgenic line Tg(MPO:EGFP)×Tg(LysC:DsRed) in control (C) and at different time points (4 h, 6 h, and 14 h) after H/R. Neutrophils are either yellow (LysC+/MPO+) or green (predominantly, MPO+) cells (arrows in the 6 h image); red macrophages are LysC+ cells (arrow in the 4 h image). Hoechst stains cell nuclei; (a-d) calibration bar = 100 µm, (e-h) calibration bar = 20 µm.The peak inflammatory response occurred at the 6 h time point after H/R This experiment was performed three times with similar results. |
| Genes: | |
|---|---|
| Fish: | |
| Condition: | |
| Anatomical Terms: | |
| Stage: | Adult |