
Fig. S2
- ID
- ZDB-FIG-120427-18
- Publication
- Singh et al., 2012 - Regeneration of amputated zebrafish fin rays from de novo osteoblasts
- Other Figures
- All Figure Page
- Back to All Figure Page
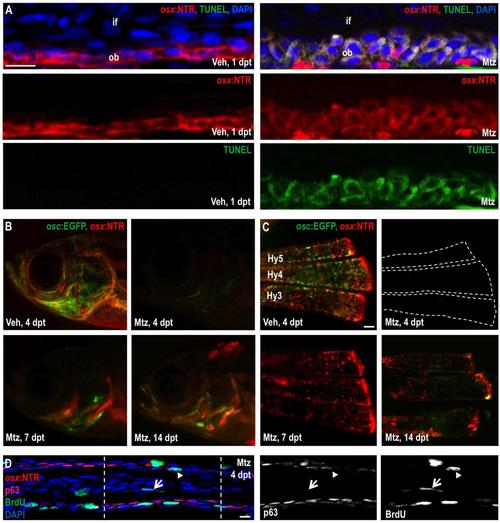
Effects of Osteoblast Ablation (A) High magnification image of TUNEL staining of osx:NTR fins 24 hours after vehicle (left) or Mtz (right) treatment. TUNEL signals were not detected in vehicle-treated osteoblasts, while only osx:NTR+ cells displayed TUNEL staining after Mtz treatment. Note that osteoblasts show an atypical rounded appearance 24 hours after Mtz treatment, as well as perinuclear/cytosolic TUNEL staining similar to what that reported for cardiomyocytes after diphtheria toxin A-mediated ablation (Wang et al., 2011). Scale bar = 100 μm. (B) Cranial images of osx:NTR; osc:EGFP fish, showing major loss of osteoblast marker fluorescence within 4 days of Mtz treatment. Expression of osx:NTR is undetectable, while very low green fluorescence can be detected. Autofluorescence may be a factor due to a higher exposure time than Figure 2A. osx:NTR and osc:EGFP signals show recovery at 7 and 14 days post-treatment (dpt). (C) Hypurals 3, 4 and 5 (Hy3-5) of adult osx:NTR; osc:EGFP fish were imaged after fixation and complete removal of overlying tissues. Dramatic loss of fluorescent reporters occurs by 4 days after Mtz treatment, while recovery is evident at 7 and 14 dpt. (D) BrdU was injected into osx:NTR animals 4 days after Mtz treatment. Tissue is co-stained with p63 (magenta), which marks basal epidermal cells. Proliferating epidermal cells (arrowhead) and non-epidermal cells (arrow) are evident in the absence of detectable osteoblasts, indicating a diverse cellular proliferative response to the ablation. |
Reprinted from Developmental Cell, 22(4), Singh, S.P., Holdway, J.E., and Poss, K.D., Regeneration of amputated zebrafish fin rays from de novo osteoblasts, 879-886, Copyright (2012) with permission from Elsevier. Full text @ Dev. Cell