
Fig. 2
- ID
- ZDB-FIG-120427-13
- Publication
- Singh et al., 2012 - Regeneration of amputated zebrafish fin rays from de novo osteoblasts
- Other Figures
- All Figure Page
- Back to All Figure Page
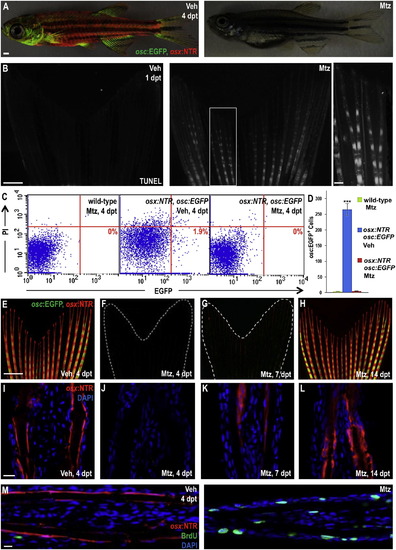
Inducible Ablation and Recovery of Adult Zebrafish Osteoblasts (A) Juvenile osx:NTR; osc:EGFP fish treated with vehicle (left) or Mtz (right) and assessed for fluorescence 4 days later. There was no detectable marker expression in Mtz-treated animals. Scale bar = 1 mm. (B) TUNEL staining of osx:NTR fins 24 hr after vehicle (left) or Mtz (right) treatment, indicating profound, osteoblast-specific apoptosis (white) in Mtz-treated fish. Higher magnification images are shown in Figure S2. Scale bar = 100 μm. (C) Flow cytometric analysis of caudal fin cells from wild-type (nontransgenic) and osx:NTR; osc:EGFP fish treated with vehicle or Mtz. Single cell suspensions were stained with propidium iodide (PI) and analyzed for EGFP. Representative plots are shown in (C); numbers in the lower right box indicate relative percentages of osc:EGFP+ cells. (D) Absolute osc:EGFP cell counts (per 10,000 cells) from data in (C). Data are mean ± SEM from nine animals each. ***p < 0.001, Student′s t test. Wild-type and Mtz-treated osx:NTR; osc:EGFP samples show no significant difference in osc:EGFP+ cells, indicative of complete osteoblast loss. (E–H) Caudal fins of osx:NTR; osc:EGFP fish lose osteoblast fluorescence within 4 days of Mtz treatment (E and F). Expression of osx:NTR can be detected beginning at 7 days posttreatment (dpt) (G), more easily in tissue sections than whole-mount images. Expression recovers completely by 14 dpt (H). Scale bar = 1 mm. (I–L) Longitudinal sections of osx:NTR fins at time points indicated in (E)–(H). osx:NTR fluorescence disappears by 4 dpt and recovers in the osteoblast compartment by 14 dpt. Scale bar = 100 μm. (M) BrdU immunofluorescence (green) analysis of vehicle- (left) or Mtz-treated (right) osx:NTR animals 4 days posttreatment, indicating enhanced cellular DNA synthesis in Mtz-treated samples. Scale bar = 100 μm. See Figure S2. |
Reprinted from Developmental Cell, 22(4), Singh, S.P., Holdway, J.E., and Poss, K.D., Regeneration of amputated zebrafish fin rays from de novo osteoblasts, 879-886, Copyright (2012) with permission from Elsevier. Full text @ Dev. Cell