
FIGURE
Fig. 6
Fig. 6
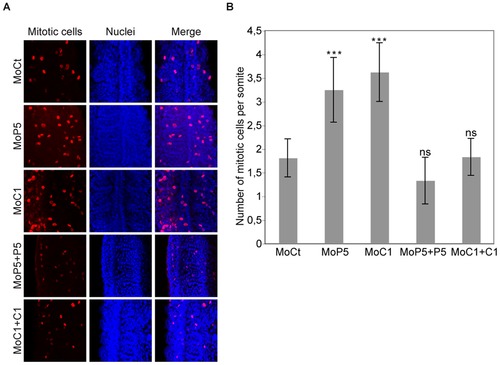
CARM1 and PRMT5 control cell cycle arrest during development. (A) Dorsal flat-mounted of 14 ss embryos (anterior top) injected with the indicated Mo or co-injected with the corresponding mRNA for rescue experiments were analyzed by immunohistochemistry for mitotic cells with an anti phospho-H3 (Ser10) antibody. (B) Representation of the number of mitotic cells per somite. Error bars represent standard deviations. ***, P<0.0001 extremely statistically significant; ns, not statistically significant, using a t-test. |
Expression Data
Expression Detail
Antibody Labeling
Phenotype Data
| Fish: | |
|---|---|
| Knockdown Reagents: | |
| Observed In: | |
| Stage: | 14-19 somites |
Phenotype Detail
Acknowledgments
This image is the copyrighted work of the attributed author or publisher, and
ZFIN has permission only to display this image to its users.
Additional permissions should be obtained from the applicable author or publisher of the image.
Full text @ PLoS One