Fig. 5
- ID
- ZDB-FIG-110922-8
- Publication
- Pyati et al., 2011 - p63 Mediates an Apoptotic Response to Pharmacological and Disease-Related ER Stress in the Developing Epidermis
- Other Figures
- All Figure Page
- Back to All Figure Page
|
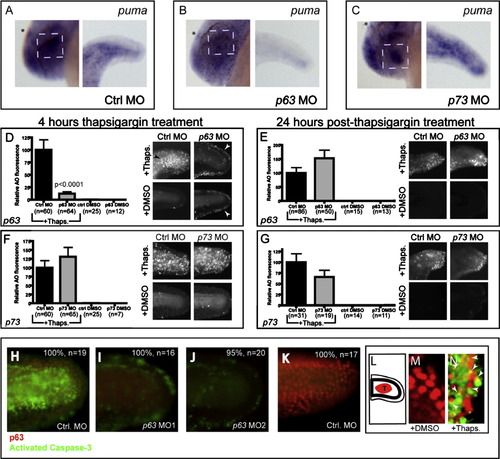
p63, but Not p73, Is Required for ER Stress-Induced puma Expression and 4 Hr Apoptosis (A and B) Compared to thapsigargin-treated control morphants (100% with high puma expression, n = 16) thapsigargin-treated p63 morphants had reduced puma expression in the epiphysis, lens, and tail (78% with reduced expression, n = 18). (C) Thapsigargin-treated p73 morphants had similar puma expression (94%, n = 18) compared to control morphants. Asterisk, epiphysis; dashed box, lens. (D and E) p63 and control morphants were assayed for apoptosis by AO staining at 4 hr after thapsigargin or DMSO treatment, or (E) washed out and assayed by AO staining 24 hr later. See also Figure S4 and Figure S5. In (D), note the weak AO staining in the outer fin epidermis (white arrowheads) of p63 morphants, regardless of thapsigargin treatment, but the nearly complete block of cell death in the lateral epidermis compared to the same region in thapsigargin-treated control morphants (black arrowhead). (F and G) p73 morphants were processed the same as for p63 morphants. p73 morpholino injection does not block either (F) 4 hr thapsigargin-induced apoptosis or (G) 28 hr thapsigargin-induced apoptosis. (H–J) Embryos were injected with either (H) control morpholino, (I) p63 MO1 or (J) p63 MO2, then treated with thapsigargin for 4 hr and assayed for p63 expression (red) and activated Caspase-3 (green) by immunofluorescence microscopy. Note the severe reduction in p63 and Caspase-3 expression in both p63 morphants (I and J) compared to control morphants (H). (K) Control embryos treated with DMSO showed extensive p63 expression with minimal Caspase-3 positivity. (L–N) Confocal analysis of coimmunofluorescence in embryos treated with DMSO (M) or thapsigargin (N) to analyze p63 expression (red) and activated Caspase-3 (green). Note the extensive colocalization of activated Caspase-3 with p63 in (N), marked with arrowheads. (L) A schematic representation of the imaged region in (M) and (N). All graphical data are represented as means ± SEM. |
| Gene: | |
|---|---|
| Antibodies: | |
| Fish: | |
| Condition: | |
| Knockdown Reagents: | |
| Anatomical Terms: | |
| Stage: | Prim-5 |
Reprinted from Developmental Cell, 21(3), Pyati, U.J., Gjini, E., Carbonneau, S., Lee, J.S., Guo, F., Jette, C.A., Kelsell, D.P., and Look, A.T., p63 Mediates an Apoptotic Response to Pharmacological and Disease-Related ER Stress in the Developing Epidermis, 492-505, Copyright (2011) with permission from Elsevier. Full text @ Dev. Cell

